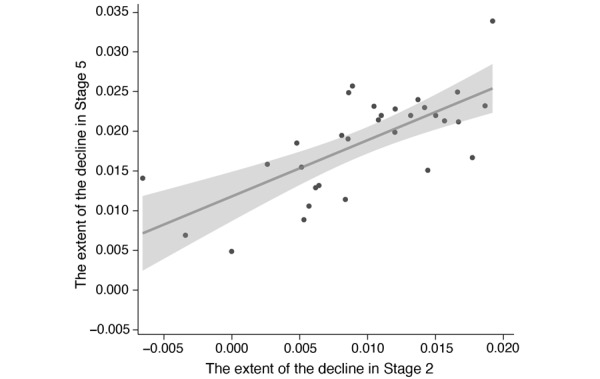
Figure 3.

A correlation between the declines observed in social media public sentiment values in stage 2 with those in stage 5. Black dots represent the extent of the decline of public sentiment values in each province in mainland China. The solid line represents the fitted linear curve of the extent of the decline in two stages (R2=.50, P<.001, 95% CI 0.473-0.978).
