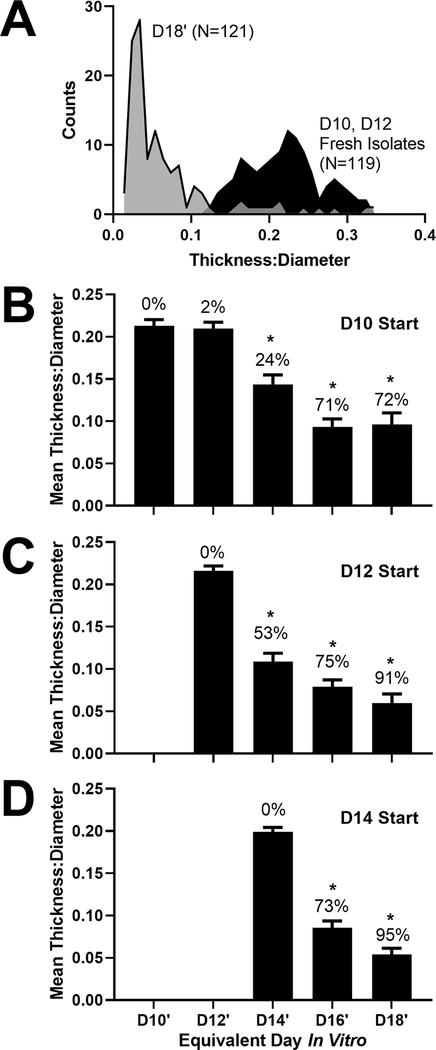
Fig. 3.
Impact of start date on the change in vesicle morphology over time. (A) Histogram of the morphology of fresh vesicle isolates and long-term cultures in 100% Matrigel. Thickness:diameter ratio is reported for fresh vesicle isolates from D10 and D12 aggregate cultures (N = 119) and from long-term cultures at equivalent culture D18 (N = 121; D18′, from D10 + 8, D12 + 6, D14 + 4 groups). Measurements were made from more than 10 independent cultures in each group. (B)-(D) The mean thickness:diameter ratio is shown for OVs isolated from D10, D12, and D14 aggregates and cultured in droplets of 100% Matrigel. Error bars represent one standard error of the mean. The percentage of vesicles adopting a cyst-like shape, based on a ratio cutoff of 0.11, is shown above each bar. *, P < 0.01 for Tukey-HSD post-hoc test compared to the day of isolation. Sample sizes per group: (B) D10 N = 44, D10 + 2 N = 40, D10 + 4 N = 38, D10 + 6 N = 35, D10 + 8 N = 32; (C) D12 N = 78, D12 + 2 N = 74, D12 + 4 N = 72, D12 + 6 N = 34; (D) D14 N = 75, D14 + 2 N = 62, D14 + 4 N = 44.

