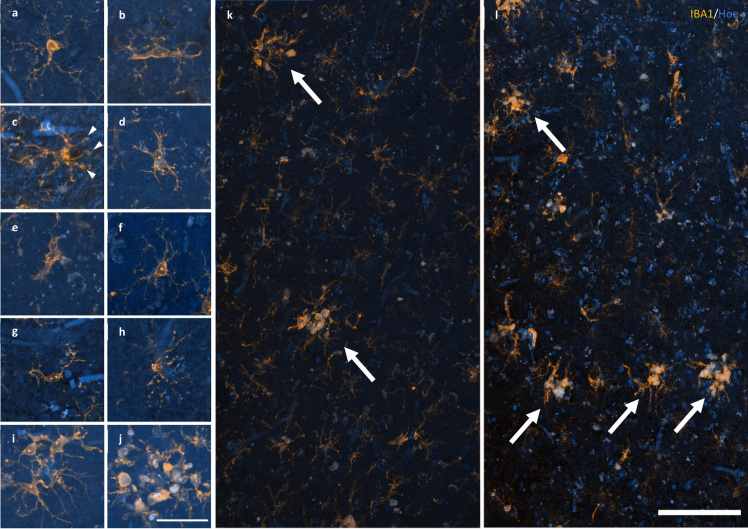
Figure 2.
Response of microglia to AD pathology. a–e A spectrum of microglial activation can be identified by a series of morphological changes including an enrichment of IBA1 labelling of the soma and primary processes (a), hypertrophy of the primary processes (b), retraction of tertiary processes ± the formation of morphological features consistent with phagosomes (arrow heads) (c), further retraction of secondary processes (d), until amoeboid in shape (e). f–h Healthy ramified microglia have a small, spherical soma and thin, evenly distributed processes (f), contrasting with dystrophic microglia that have either deramified and tortuous processes (g) or pseudo-fragmentation of processes when marked with IBA1 (h). i–j Microglia that form a cluster within the boundary of an Aβ plaque may be either dystrophic or have reached a phase of early (i) or late/amoeboid (j) activation. k–l Mosaics of IBA1 staining demonstrating the size and distribution of microglial clusters (arrows), defined as three or more somata occurring within, or touch the boundaries of, a 20 μm2 virtual graticule subregion, in the PMC of an HPC (k; M23) and AD case (l; M13). Scale bar in j = 40 μm (a–j); in l = 100 μm (k–l)

