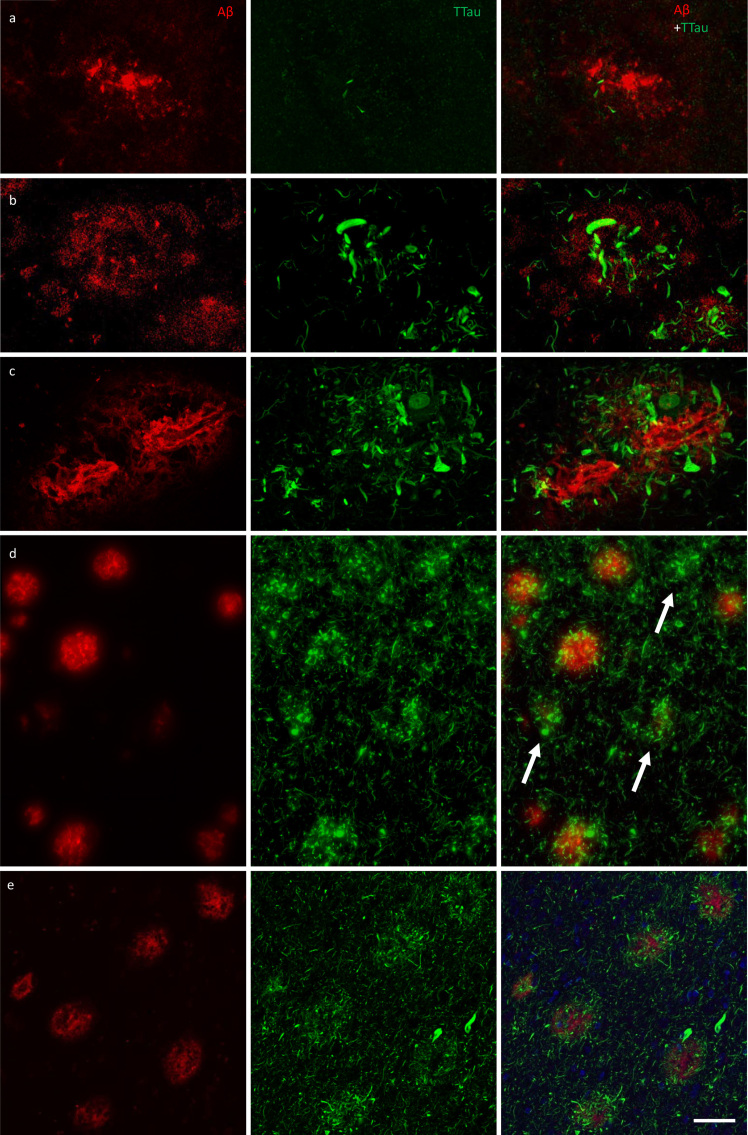
Figure 4.
Immunofluorescent double-labelling for Aβ and TTau. a–c The majority of Aβ plaques examined here were associated tau-positive dystrophic neurites, with a clear gradation visible between the PMC (a) and ITC (b) in controls (M01 pictured in a and b) and AD cases (ITC of M09 pictured in c). AD cases had the most extensive build-up of DNs in fibrillar and dense-cored plaques, as well as perivascular (capillary) Aβ deposits (c). d Remnant plaques (arrows) are characterised by absent or weak Aβ staining and dense accumulations of tau pathology and were much more common in the ITC than the PMC (also seen in b). e Severely affected regions of the AD brain, such as the ITC, showed a diffuse network of elongated NTs throughout the parenchyma as well radially projecting DNs. Scale bar = 20 μm (a–c), 60 μm (d), 40 μm (e)

