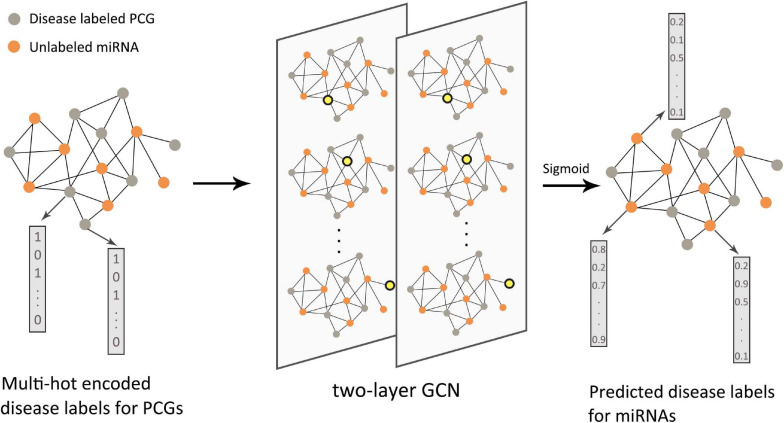
FIGURE 7.
Flow chart of DimiG in RNA–disease association. The protein-coding gene (PCG)–miRNA association network was used as the input of the two-layer graph neural network. The PCGs were labeled, and the miRNAs were unlabeled. The yellow nodes in the network represented the weighted sum of neighbor embeddings. The final output could infer the probability between diseases and unlabeled miRNAs.

