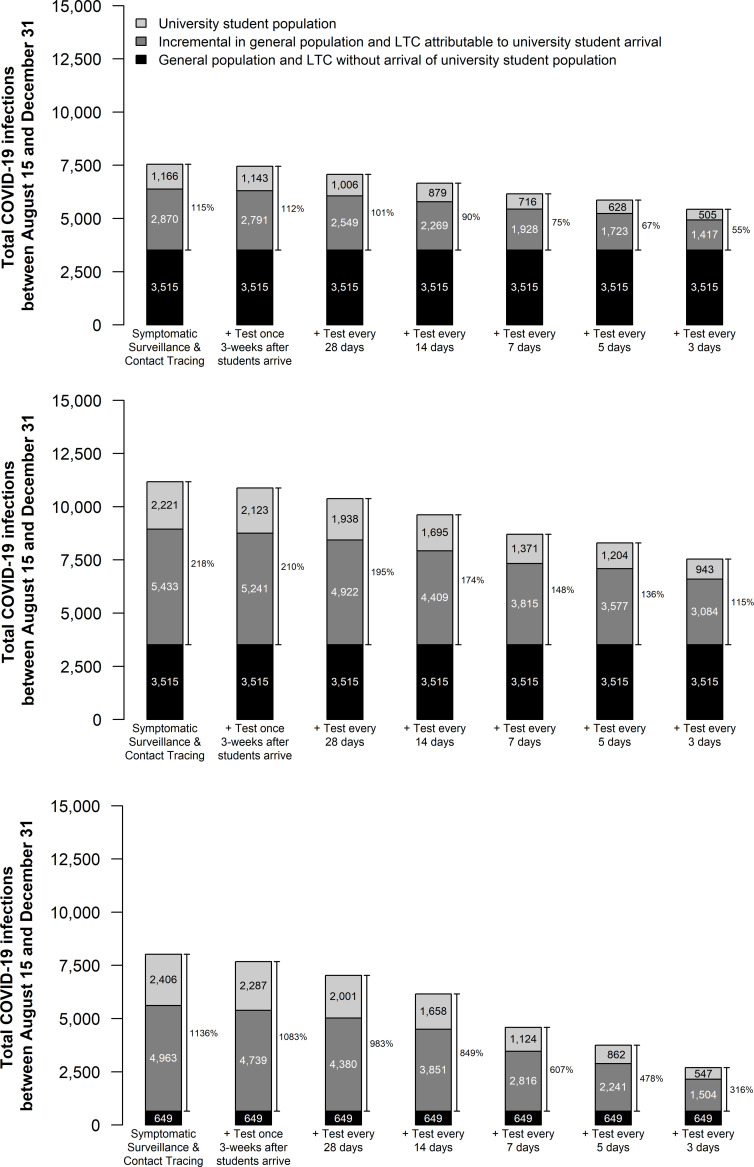
Fig 3. Cumulative number of COVID-19 infections between August 15 and December 31 in a city of 500,000 with and without the introduction of 20,000 university students on September 1.
Scenarios in each panel differ in the frequency with which students undergo routine testing for COVID-19. In panel (A), students have an average 40% reduction in contacts compared to normal student social interaction behaviour (average of 23.7 contacts reduced to 14.1 contacts) immediately upon arrival with no short-term increase in contacts; in panel (B), students double their contacts with other students for the first two weeks (28.4 contacts with other students, resulting in a total of 37.9 total contacts per day) and then implement a 40% reduction in their baseline contacts (average of 23.7 total contacts reduced to 14.1 total contacts); in panel (C), students double their contacts with other students for the first two weeks and then implement a 40% reduction in contacts and 50% of the general population is participating in high-intensity physical distancing (compared to 40% in the base case and other scenarios presented in this figure). Other outcomes for these scenarios are reported in Appendix Table 5 in S1 File.

