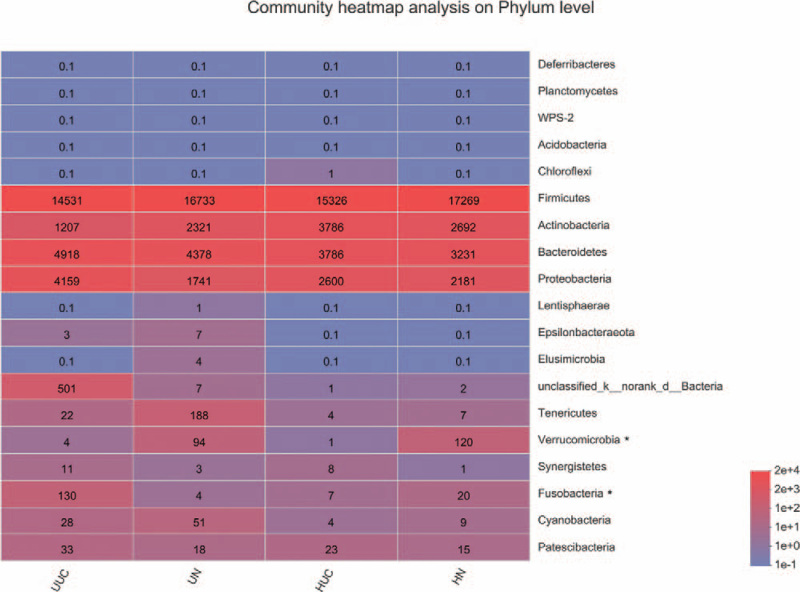
Figure 3.
Heatmap analyses of abundant phylum in each group. The abscissa is the group name, and the ordinate is the species name. The color gradient shows the abundance changes of different species in each group of samples. The right side of the figure is the value represented by the color gradient. The taxa of interest are marked with the asterisk.

