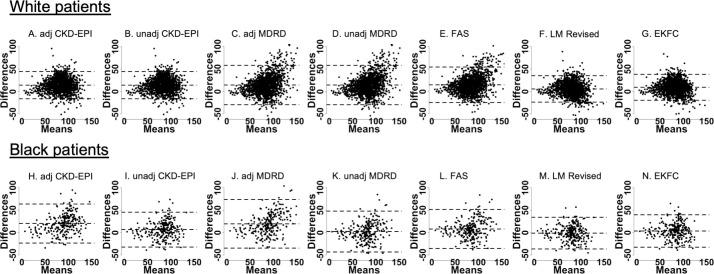
Fig 4. Bland-Altman plots for eGFR equations compared to mGFR, stratified by ethnicity.
(White, Black) participants: (A, H) adjusted CKD-EPI, (B, I) unadjusted CKD-EPI, (C, J) adjusted MDRD, (D, K) unadjusted MDRD, (E, L) FAS, (F, M) LM Revised, (G, N) EKFC. x-axes show the mean between the mGFR and eGFR measurements ([mGFR+eGFR]/2) and y-axes show the differences between the mGFR and eGFR measurements. Units: ml/min/1.73m2. The central dashed line represents bias, and the dashed lines above and below represent the 95% limits of agreement.

