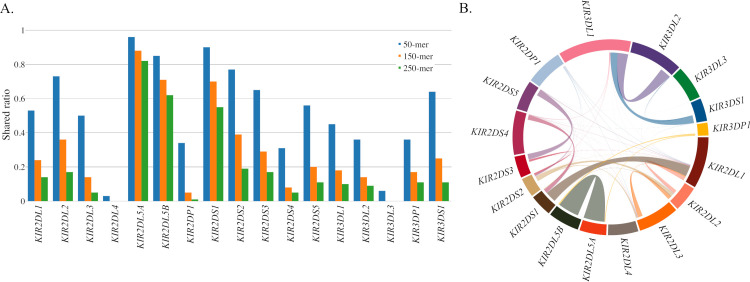
Fig 4. K-mer analysis of KIR gene sequence similarity.
(A) Ratio of distinct k-mers of size 50, 150 and 250 that are shared between the indicated KIR gene and others. The inverse of these bars (not shown) would indicate the proportion of k-mers that are distinct to that gene and not found in the alleles of other genes. (B) 150-mer connections between KIR genes, the size of the connecting line roughly indicates the total number of shared 150-mers.

