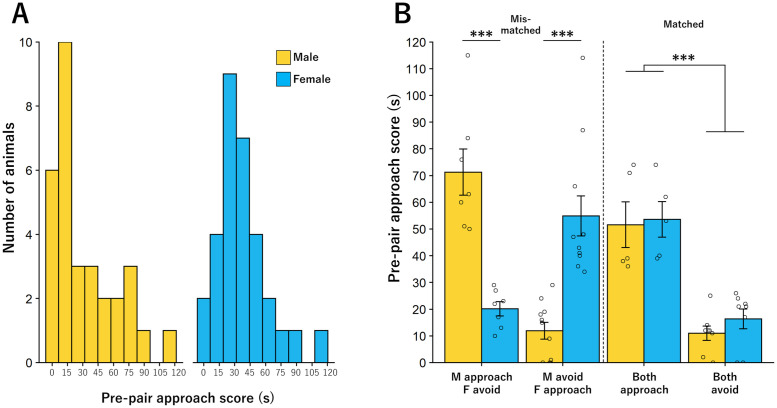
Fig 2. Individual responses to bark call playback.
A. Histogram of pre-pair approach behaviors for males (yellow) and females (blue). B. Mean approach behaviors for each of the four paired. Significant differences were seen in approach behavior of mismatched but not matched pairs (* = p < 0.05). Bar graphs represent Mean +/- SEM.

