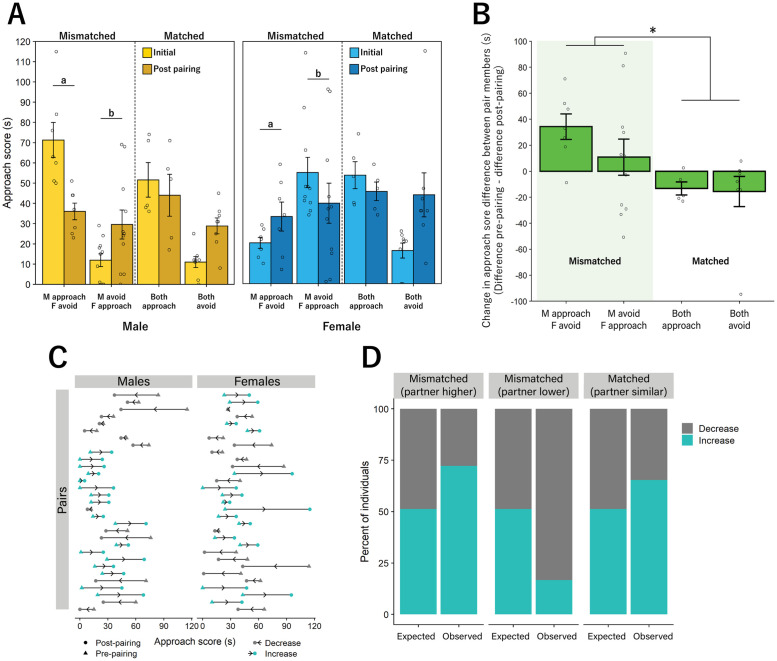
Fig 3. Pairs increased similarity in approach to bark call playback.
A. Both male (left) and female (right) mismatched pairs altered their approach scores post pairing to become significantly more similar to their partner while matched pairs showed no significant difference in approach across the two time points. B. Mismatched pairs (left) showed a significant change in difference score between pairs from pre-pairing to post-pairing testing compared to matched pairs. C. Plots of individual changes in approach from pre-pairing test to post-pairing test. Increased approach scores are denoted by blue circles, while decreased approach scores are denoted by gray circles. D. The number of individuals that increased or decreased their approach score post pairing, compared to expected values based on random change in approach behavior. Members of mismatched pairs were more likely to systematically increase or decrease their approach score to match that of their partner, while matched pairs did not vary from expected outcomes. (a, b, * = p < 0.05). Significant lower-order effects were not indicated for any analyses. Bar graphs represent Mean +/- SEM.

