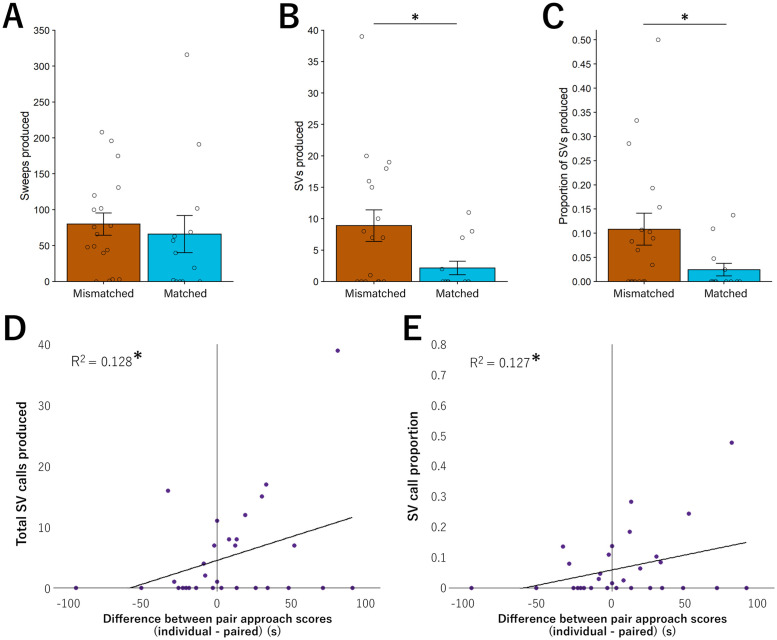
Fig 4. USVs correlated with behavioral coordination.
A. Total number of sweeps were similar between mismatched and matched pairs B. Total number of SV calls increased in mismatched pairs compared to all other groups. C. The proportion of SV calls as a function of total calls was greater in mismatched pairs compared to matched pairs. D. Pairs with greater similarity in post-pairing approach scores produced more SVs as a dyad. Pairs that became more similar (pre-pairing approach score difference—post-pairing approach score difference) as denoted by positive numbers on the x-axis, produced more total SV calls as well as E. a significantly greater proportion of SV calls to total USV calls produced (* = p < 0.05). Bar graphs represent Mean +/- SEM.

