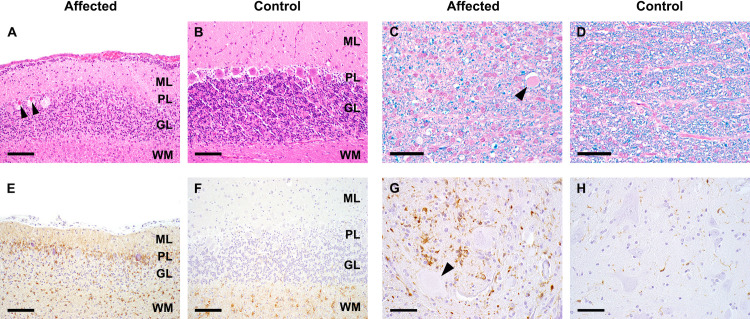
Fig 2. Histopathological examination.
A, B Cerebellum: Marked attenuation of all cortical layers and necrotic Purkinje cells (arrowheads) (A) compared to control (B). ML: molecular layer, PL: Purkinje cell layer, GL: granule cell layer, WM: white matter; HE-staining, bar = 100 μm. C, D Spinal cord white matter: Diminished myelination (blue staining) and axonal degeneration (arrowhead) (C) compared to control (D); HE-LFB staining, bar = 50 μm. E, F Cerebellum: Increased numbers and activation of astrocytes particularly in Purkinje cell and granule cell layer (E) compared to control (F); GFAP-IHC, bar = 100 μm. G, H Spinal cord gray matter: Increased numbers and activation of microglia associated with neuronal degeneration (arrowhead) (G) compared to control (H); Iba1-IHC, bar = 50 μm.

