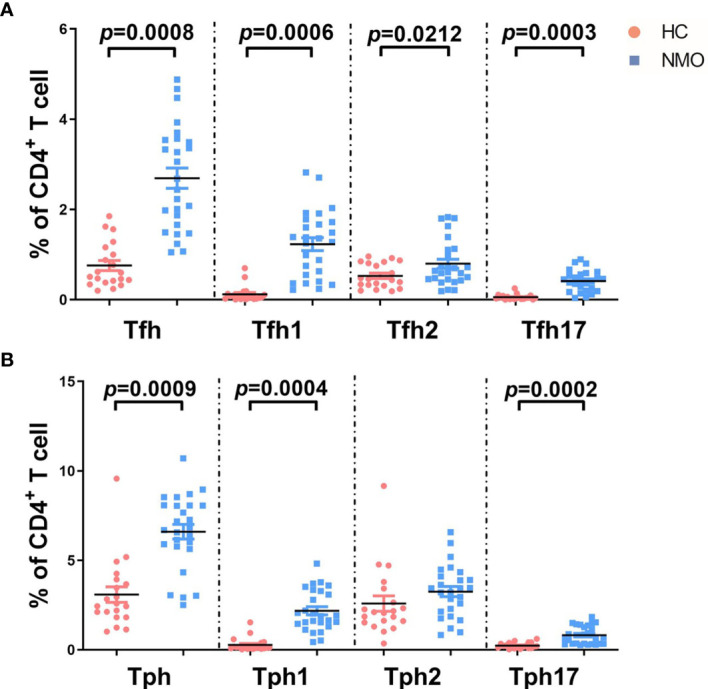
Figure 3.

The comparison of T cell subsets distribution in healthy controls and patients with NMOSD. (A) Proportions of T follicular helper (Tfh: CD4+CXCR5+PD-1high) and subsets among total CD4+ cells in patients with NMOSD and healthy controls (HC); (B) Proportions of peripheral T helper (Tph: CD4+CXCR5-PD-1high) and subsets. Tfh1 (CXCR3+CCR6–), Tfh2 (CXCR3–CCR6–), and Tfh17 (CXCR3–CCR6+), Tph1 (CXCR3+CCR6–), Tph2 (CXCR3–CCR6–), and Tph17 (CXCR3–CCR6+). Unpaired, two-tailed Student’s t tests were used. HC: n=20; NMOSD: n=26.
