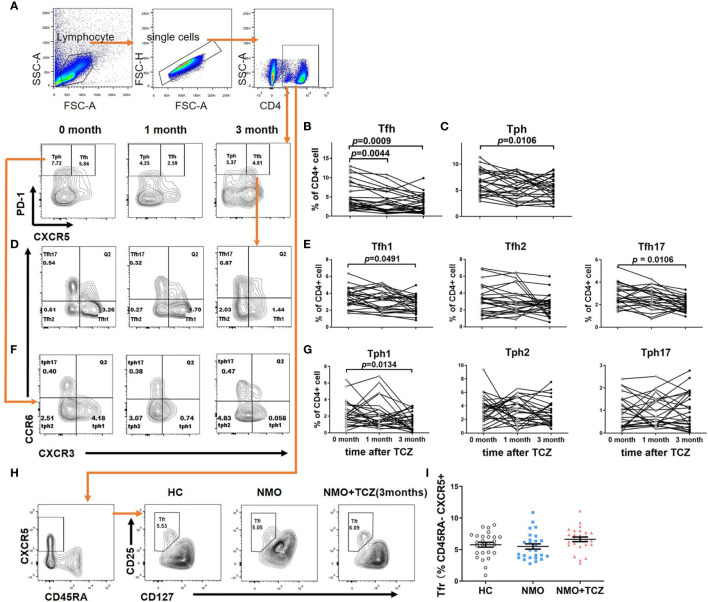
Figure 4.
T cells subsets distribution in NMOSD patients before and after tocilizumab. (A, D, F) showed gating strategy for subsets of T Follicular Helper Cell (Tfh) & peripheral T helper cells (Tph) and representative flow cytometry plot at baseline and after treatment for 1month or 3 months. (B, C, E, G) Quantitative analysis of proportion of total Tfh and its subsets: Tfh1 (CD4+CXCR5+PD-1highCXCR3+CCR6–), Tfh2 (CD4+CXCR5+PD-1highCXCR3–CCR6–) and Tfh17 (CD4+CXCR5+PD-1highCXCR3–CCR6+), total Tph and its subsets: Tph1 (CD4+CXCR5-PD-1highCXCR3+CCR6–), Tph2 (CD4+CXCR5-PD-1highCXCR3–CCR6–), and Tph17 (CD4+CXCR5-PD-1highCXCR3–CCR6+) at baseline and after treatment for 1month or 3 months (n=19). (H) Gating strategy for T follicular Regulatory cells (Tfr) and flow cytometry plot of a control and a representative NMOSD patient (before and after tocilizumab 3 months). (I) Quantitative analysis of proportion of Tfr in healthy controls and NMOSD patient before and after tocilizumab 3 months (n=26). Differences were considered statistically significant for P<0.05. Paired, two-tailed Student’s t tests (if the distribution is normal) or Wilcoxon matched pairs tests (if it does not conform to the normal distribution) were used to compare baseline and post-treatment results, n=26.

