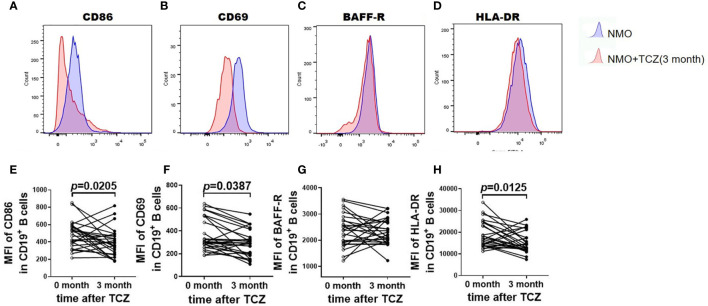
Figure 5.
Tocilizumab alters the expression level of activation marker. (A–D) was the representative flow cytometric histogram after surface staining activation marker on total B cells (CD19+) from NMOSD patients before and after tocilizumab treatment. (E–H) was the quantitative analysis of the mean fluorescence intensity (MFI) of CD86, CD69, BAFF-R, HLA-DR in CD19+cells before and after tocilizumab treatment. Difference was considered statistically significant for P < 0.05. Paired, two-tailed Student’s t tests were used, n=26.

