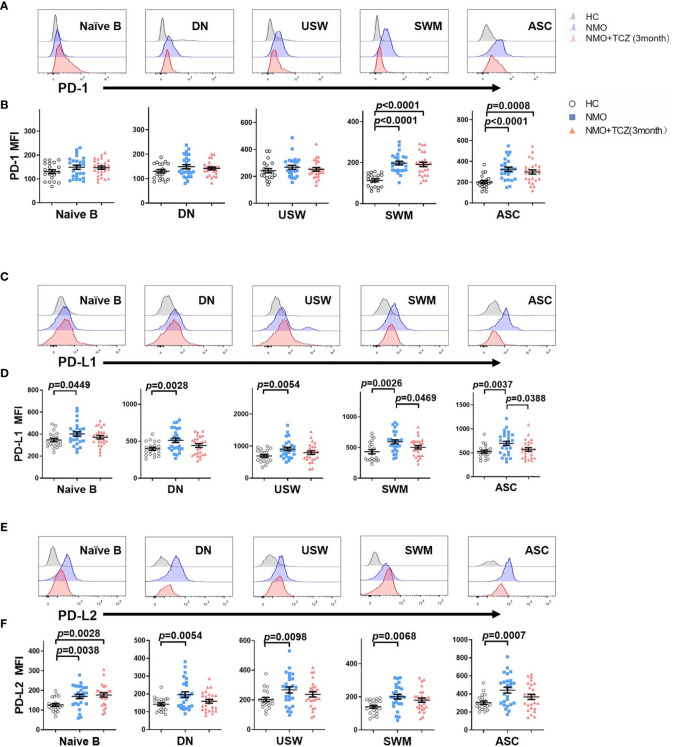
Figure 6.
The expression of PD-1 and its corresponding ligands PD-L1 and PD-L2 on B cells subsets from healthy control (HC) and NMOSD patients before and after treatment. (A, C, E) Representative histograms of PD-1, PD-L1, PD-L2 in several B cells subsets from a healthy control and NMOSD patients before and after treatment. (B, D, F) was the quantitative analysis of mean fluorescence intensity (MFI) of PD-1, PD-L1&PD-L2 in several B cells subsets. Unpaired, two-tailed Student’s t tests (if the distribution is normal) or Mann-Whitney U tests (if it does not conform to the normal distribution) were used, n=26.

