
FIGURE 8.
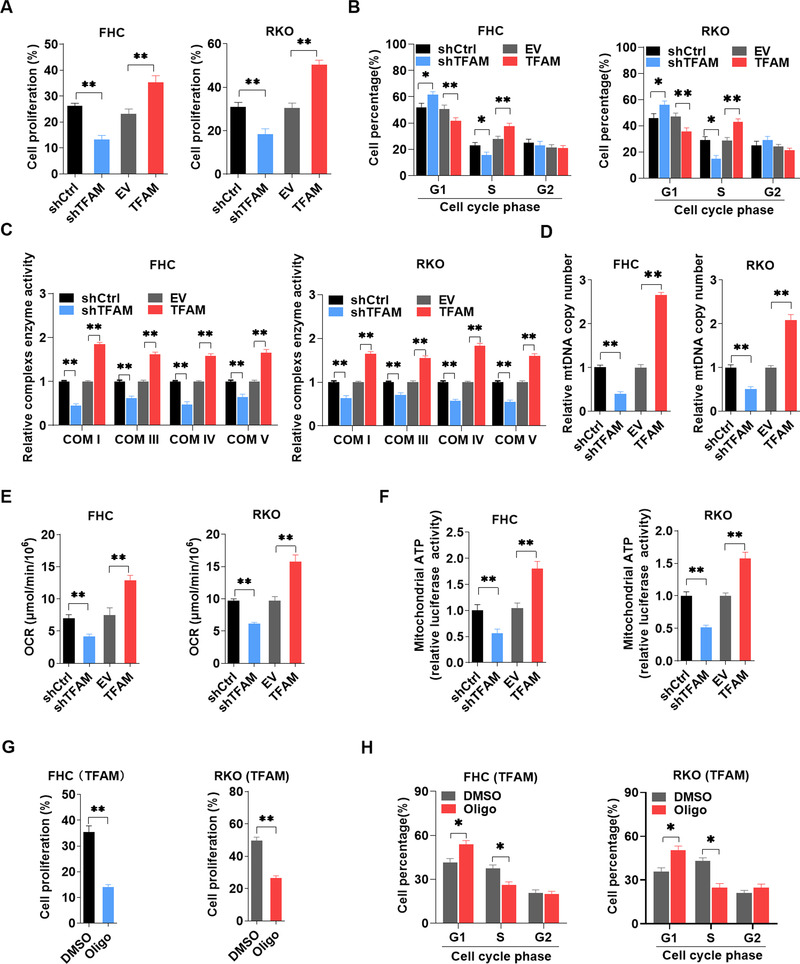
TFAM promotes the proliferation of both IECs and colorectal cancer cells by increasing mitochondrial biogenesis and activity. (A) EdU incorporation assay analysis for cell proliferation in FHC and RKO cells with TFAM knockdown or overexpression. (B) Flow cytometry for cell cycle analysis in FHC and RKO cells with TFAM knockdown or overexpression. (C) Relative mitochondrial respiratory chain complex enzyme (I, III, IV, and V) activity in FHC and RKO cells with TFAM knockdown or overexpression. (D‐F) Relative mtDNA copy number, OCR, and mitochondrial ATP levels in FHC and RKO cells with TFAM knockdown or overexpression. (G) EdU incorporation assay analysis for cell proliferation in FHC and RKO cells with TFAM overexpression and oligomycin treatment. (H) Flow cytometry for cell cycle analysis in FHC and RKO cells with TFAM overexpression and oligomycin treatment. Error bars represent mean ± SD. Data were analyzed using Mann‐Whitney U test. **P < 0.01, *P < 0.05. Abbreviations: TFAM, mitochondrial transcription factor; EdU, 5‐ethynyl‐2’‐deoxyuridine; OCR, oxygen consumption rate; SD, standard deviation; shCtrl, control shRNA; shTFAM, shRNA expression vector against TFAM; EV, empty vector; TFAM, expression vector encoding TFAM; shRNA, short hairpin RNA; Oligo: oligomycin