. 2021 Aug 12;10:e68227. doi: 10.7554/eLife.68227

Figure 1. LMO2 is critical for the maintenance of T-cell differentiation potential in Ebf1-deficient pro-B cells.

(A) Establishment of Ebf1-deficient pro-B cell lines with or without differentiation potential to the T-cell lineage. Lineage markers (CD19, Gr1, TER119, NK1.1)-negative, c-kit-positive cells in Ebf1−/ FL were cultured on TD7 or OP9 cells, and Ebf1-deficient pro-B cell lines were established. Stably growing pro-B cells with or without T-cell potential (pro-B(+) or pro-B()) were cultured on OP9-Mock (Mock) or OP9-Dll4 (Dll4) cells with Flt3L, SCF, and IL7 for 6 days and analyzed for the expression of CD44 and CD25 (right panels) in the lymphoid cell gate (FSC vs. SSC, left panels) by flow cytometry. The numbers in the profiles indicate the relative percentages in each corresponding quadrant or fraction. Numbers of CD25+ cells (fold expansion/input) are shown with standard deviation (SD) (right). Statistical analysis was performed using the two-tailed Student’s t-test. **p<0.01. Data are representative of three independent experiments with similar results. (B) Reverse transcription (RT)-quantitative PCR (qPCR) detection of Meis1, Hmga2, Bcl11a, or Lmo2 transcripts in pro-B(−) (closed columns) and pro-B(+) (open columns) cells. Data represent the mean values of three independent biological replicates, and all values are normalized to the expression of Actb. Error bars indicate SD. Three independent experiments were performed, and similar results were obtained. (C) Representative intracellular staining profiles of LMO2 and c-Myc in pro-B() (open blue line) and pro-B(+) (open red line) cells are shown. Closed lines (orange) represent staining with control rabbit mAb of pro-B() and pro-B(+), which were completely merged. The average mean fluorescent intensity (MFI) of LMO2 is shown with SD (right). A two-tailed Student’s t-test was used for statistical analysis. **p<0.01. Three independent experiments were performed with similar results. (D) Introduction of Lmo2 is sufficient to maintain the T-cell differentiation potential in pro-B cells. Empty vector- or Lmo2-transduced pro-B() cells (pro-B()/Mock or pro-B()/LMO2) were cultured on OP9-Dll4 for 6 days and analyzed for the expression of CD44 and CD25 (right panels) in lymphoid cell gate (left panels) and rat CD2+ (lentivirus-infected) CD45+ fraction. Numbers of CD25+ cells (relative expansion/input) are shown with SD (right). **p<0.01 by two-sided Student’s t-test. Six independent experiments were performed with similar results.

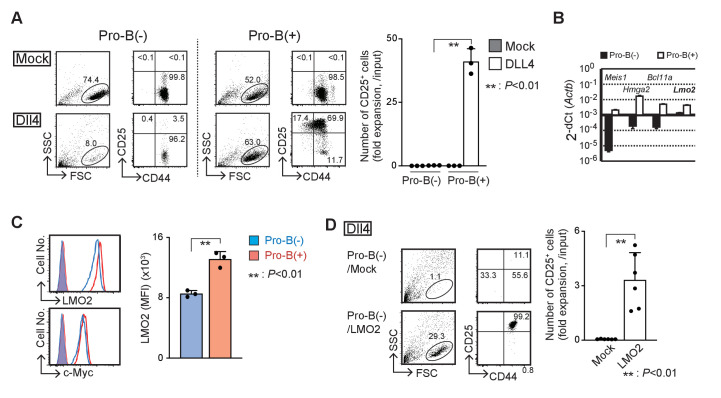
Figure 1—source data 1. Raw data used to generate the graph in Figure 1A.
Figure 1—source data 2. Raw data used to generate the graph in Figure 1B.
Figure 1—source data 3. Raw data used to generate the graph in Figure 1C.
Figure 1—source data 4. Raw data used to generate the graph in Figure 1D.

Figure 1.

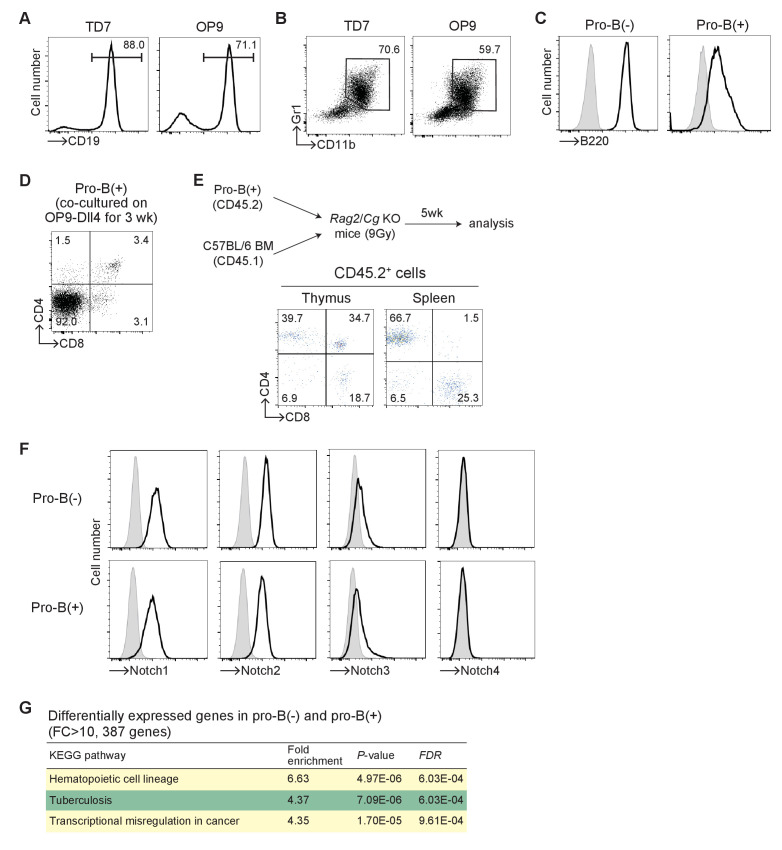
Figure 1—figure supplement 1. Characterization of pro-B(+) and pro-B(−) cells.

Figure 1—figure supplement 1.

(A) The stromal cell line TD7 can support B-cell differentiation. BM progenitor cells from C57BL/6 mice were co-cultured with the TD7 or OP9 thymic stromal cells for 6 days. Representative CD19 profiles in lymphocytes are shown. Results represent two independent biological replicates. (B) Lin+ cells are generated more frequently on TD7 than on OP9 monolayers. Fetal liver-derived HSCs from Ebf1-deficient mice were cultured on TD7 or OP9 monolayers for 3 days. Representative CD11b/Gr1 profiles among the CD45+ lymphocytes are shown. Results are representative of two independent biological replicates. (C) Pro-B(−) and pro-B(+) cells express intermediate levels of B220. B220 expression in pro-B(−) and pro-B(+) cells is shown. Results represent three independent replicates. (D) Pro-B(+) cells were co-cultured with OP9-Dll4, 1 ng/ml of IL-7, and 5 ng/ml of Flt3L for 3 weeks. Thereafter, the cells were subjected to flow cytometric analysis. A representative CD4/CD8 profile in lymphocytes is shown. Results represent two independent biological replicates. (E) Pro-B(+) cells (5 × 10⁶, CD45.2) were mixed with BM cells obtained from wild-type congenic mice (2 × 10⁵, CD45.1) and transplanted into the lethally irradiated (9 Gy) Rag2/Cg-deficient hosts. The recipient mice were analyzed after 5 weeks of transplantation. Flow cytometric analysis of thymocytes and splenocytes was performed. Representative CD4/CD8 profiles among the CD45.2+ thymocytes (left) and splenocytes (right) are shown. Results are representative of two independent biological replicates. (F) Pro-B(−) and pro-B(+) cells express comparable levels of Notch receptors on their surface. Representative Notch1, Notch2, Notch3, and Notch4 profiles on pro-B(−) and pro-B(+) cells are shown. Results are representative of two independent biological replicates. (G) Kyoto Encyclopedia of Genes and Genomes (KEGG) pathway annotation of the differentially expressed genes in pro-B(+) and pro-B(−) cells (Supplementary file 1, FC > 10, n = 387) was performed using the DAVID analysis tools (https://david.ncifcrf.gov/). Top three KEGG pathway annotations are shown. Data are based on two independent biological replicates.