. 2021 Aug 12;10:e68227. doi: 10.7554/eLife.68227

Figure 2. Loss of Lmo2 leads to the differentiation arrest in pro-B(+) cells.

(A) An experimental scheme for the deletion of Lmo2 using the CRISPR/Cas9 system in pro-B cell lines is shown. (B) Retroviral vectors encoding sgRNA against luciferase (sgCont.) or LMO2 (sgLMO2) were introduced into Cas9-expressing (GFP+) pro-B(+) cells. Five (cultured on OP9-Mock for 5 days, left panels) or 10 days (cultured on OP9-Mock for 10 days, right panels) after co-cultured on OP9-Mock cells following the infection, pro-B cells were cultured again on OP9-Mock (Mock) or OP9-Dll4 (Dll4) stromal cells for 3 days. GFP+hNGFR+ sgRNA-transduced cells were gated and analyzed for CD44 and CD25 expression (left). The percentages and numbers of CD25+ cells among GFP+hNGFR+ sgRNA-transduced cells, cultured on OP9-Dll4, are shown with SD (right). The data represent the mean values of three independent biological replicates. Each value is indicated by a closed circle. **p<0.01 by two-sided Student’s t-test.

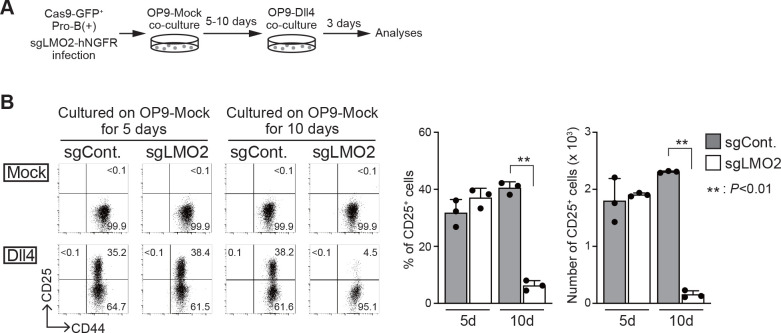
Figure 2—source data 1. Raw data used to generate the graph in Figure 2B.

Figure 2.

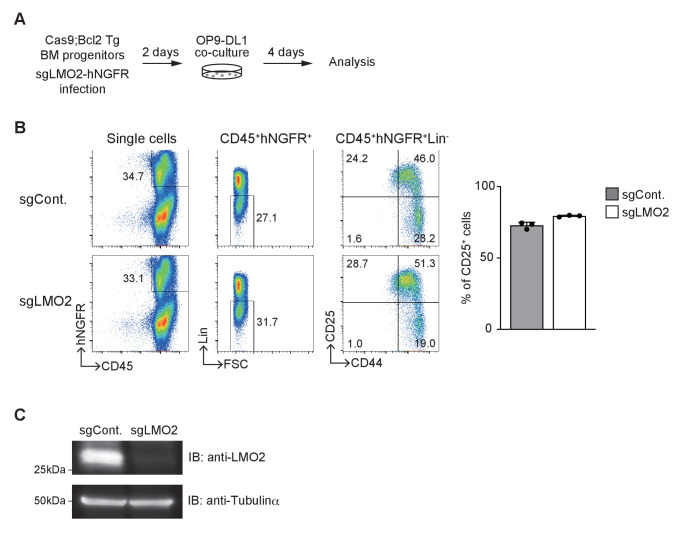
Figure 2—figure supplement 1. CRISPR/Cas9-mediated deletion of Lmo2 in BM progenitors.

Figure 2—figure supplement 1.

(A) Experimental scheme for Lmo2 deletion in primary BM progenitor cells using the CRISPR/Cas9 system is shown. (B) Flow cytometric analysis of BM progenitors transduced with sgRNA and co-cultured with OP9-Dll1 for 4 days. Representative CD45/hNGFR (sgRNA) profiles in single cells, FSC/Lin profiles in CD45+hNGFR+ cells, and CD44/CD25 profiles in CD45+hNGFR+Lin- cells are shown. Results are representative of three biological replicates. Percentages of CD25+ cells among the CD45+hNGFR+Lin- cells are shown with SD (right). (C) Specific depletion of targeted LMO2 protein. Four days after sgRNA transduction in Figure 2A, lysates from retrovirus-infected GFP+hNGFR+ Pro-B(+) cells were subjected to immunoblotting for LMO2. Two independent experiments were performed with similar results.
Figure 2—figure supplement 1—source data 1. Original data used to generate the panels in Figure 2—figure supplement 1C.
Figure 2—figure supplement 1—source data 2. Raw data used to generate the graph in Figure 2—figure supplement 1B.