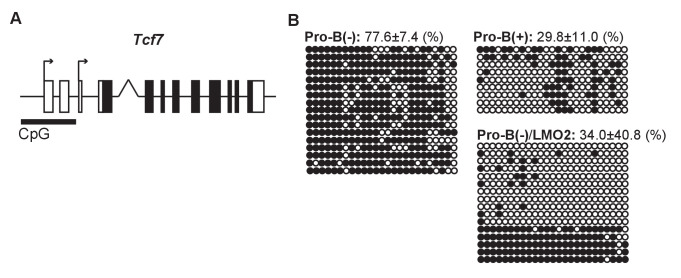
Figure 5. DNA methylation status of the Tcf7 locus is maintained by LMO2.
(A) A CpG island at the transcriptional start sites (TSSs) of the Tcf7 locus, which contains 25 potential CpG methylation sites. (B) The DNA methylation status of CpG island at the TSSs of the Tcf7 locus was determined by bisulfite sequencing in pro-B(−), pro-B(+), and LMO2-transduced pro-B(−) cells (pro-B(−)/LMO2). Bisulfite-converted genomic DNA around the TSSs of Tcf7 was amplified using PCR, and each PCR product was sequenced. The 25 horizontal circles each represent a CpG sequence derived from a single PCR product (17 clones from pro-B(−) cells, 9 clones from pro-B(+) cells, and 16 clones from pro-B(−)/LMO2 cells). Closed and open circles indicate methylated and demethylated CpG sites, respectively. The frequencies of the methylated CpGs are shown with SD. Data are based on two independent pooled experiments.


