. 2021 Jul 29;10:e70307. doi: 10.7554/eLife.70307

Figure 1. Cellular K5/K14 filaments as revealed by light and cryo-electron microscopy.

(A) The murine keratinocyte cell line K5/K14_1 expressing only K5 and K14 filaments forms a complex KIF meshwork, as revealed by confocal immunofluorescence. Cells were stained for K14 (green) and chromatin (blue). (B) Ghost cells were analyzed by cryo-EM and cryo-ET. Low-magnification image of a cell grown on an EM-grid and treated with detergent prior to vitrification. Cell boundaries (dashed white line) are detected as well as a neighboring cell (dashed black line). Typical regions that were analyzed by cryo-EM are marked (yellow circles). (C) A typical cryo-EM micrograph of a ghost cell imaged at a higher magnification allows the detection of keratin filaments and other cytoskeletal elements (n=1860). Keratin filaments (blue arrows) and actin filaments (orange arrows) are distinguished by their characteristic diameter. A large keratin bundle is visible in the top right corner. (D) Surface rendering view of a cryo-tomogram of a ghost cell (n=44). Keratin filaments (light blue), actin filaments (red), vesicles (dark blue), and cellular debris (yellow) were manually segmented. (E) Different organizations of keratin filaments observed in the cryo-EM micrographs (n=1860), including straight filaments (middle), curved (top, green arrows) and bundled filaments (bottom left). Scale bars: 100 nm. (F) Highly bent keratin filaments are found within cryo-EM micrographs of ghost cells. Scale bars: 100 nm. (G) Quantification of the minimal apparent persistence length measurements performed on (n=65) highly bent keratin filaments extracted from cryo-EM micrographs. (H) A plot combining 65 contours of filaments that were used for the minimal apparent persistence length measurements in (G). Individual filaments, shown in different colors, are aligned at their origins for visualization purposes.

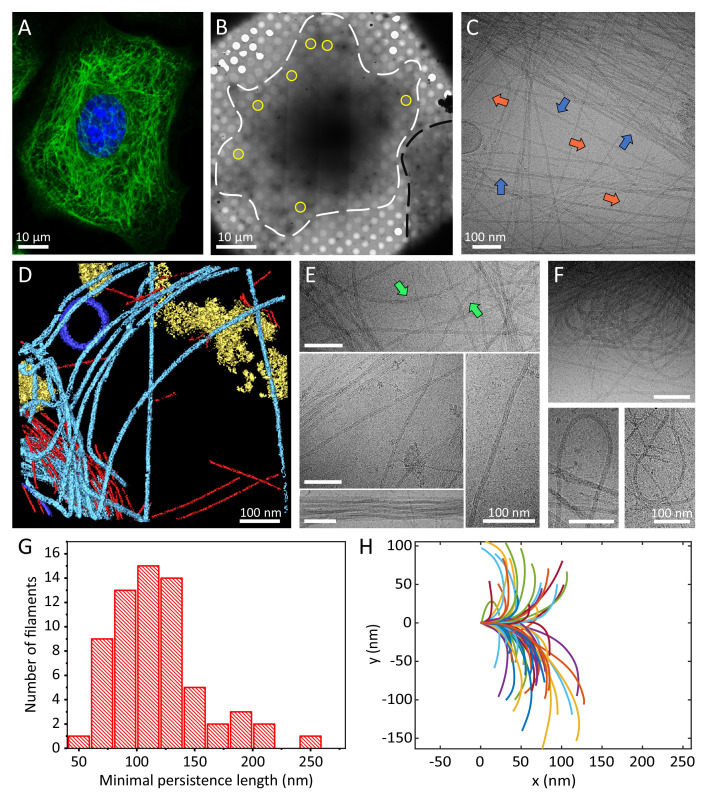
Figure 1.

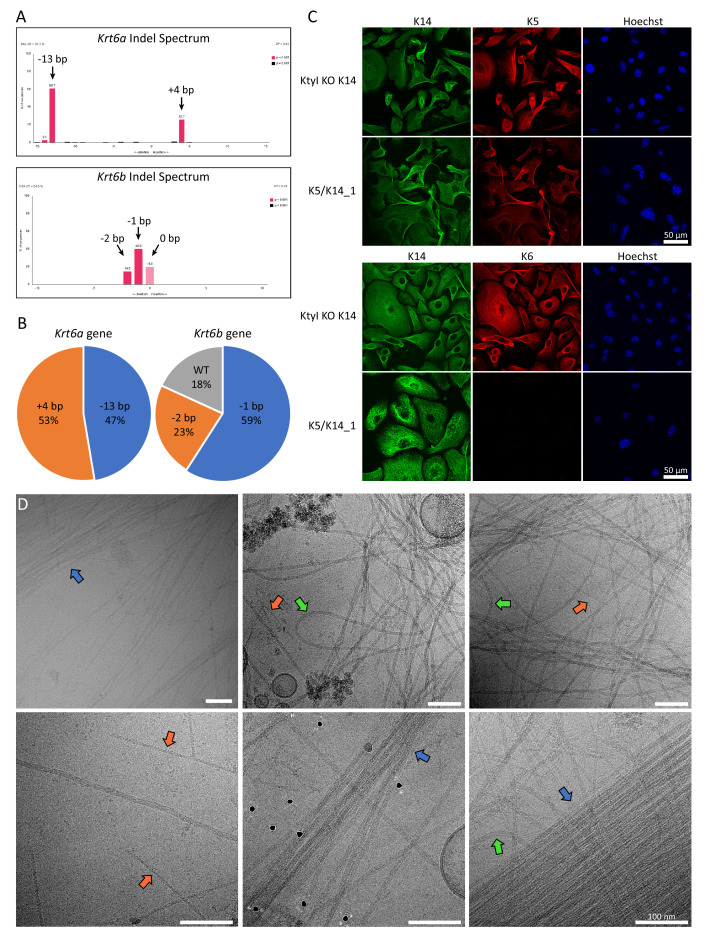
Figure 1—figure supplement 1. Knockout of K6 isoforms by CRISPR/Cas9.

Figure 1—figure supplement 1.

(A) TIDE analysis of the Krt6a and Krt6b gene sequences of the K5/K14_1 cell line carrying the mutations induced by non-homologous end joining. Genomic DNA fragments of the Krt6a and Krt6b gene were amplified by PCR and sequenced. Peaks in the Indel spectrum confirm mis-sense insertion or deletion mutations in each gene. For Krt6a, a deletion of 13 base pairs (bp) and an insertion of 4 bp were detected, while for the Krt6b gene a deletion of 2 bp and 1 bp were detected, as well as the wild-type sequence. (B) Pie chart plot of the frequency of mutations that were detected in the Krt6a and Krt6b gene of the K5/K14_1 cell line. For this analysis, PCR amplified fragments of genomic Krt6a and Krt6b DNA were ligated into the pGEM T-Easy vector and transformed into bacteria. Bacterial clones which took up individual plasmids carrying a specific mutation were cultivated and the plasmids were extracted individually and analyzed. For the Krt6a gene, 19 bacterial clones were analyzed, for the Krt6b gene, 22 bacterial clones were analyzed. (C) Immunofluorescence analysis of KtyI KO K14 cells and K5/K14_1 cells co-stained for K5 (red) and K14 (green) or K6 (red) and K14 (green). DNA was labeled with Hoechst 33342 (blue). No filamentous K6 network could be detected in the K5/K14_1 cells. Scale bars: 50 µm. (D) Representative cryo-EM micrographs of the K5/K14 network in K5/K14_1 ghost cells. Keratin filaments can be clearly distinguished from actin filaments (orange arrows). Keratin bundles (blue arrows) and very wavy filaments (green arrows) are highlighted. Scale bars: 100 nm.
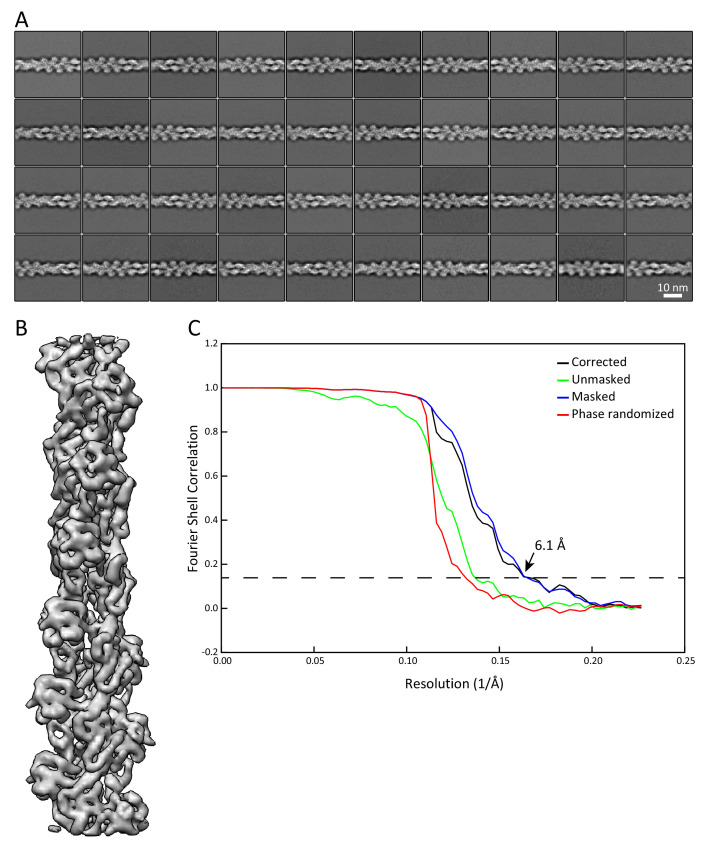
Figure 1—figure supplement 2. Validation that the sample preparation allows us to retrieve data at sub-nanometer resolution.

Figure 1—figure supplement 2.

Analysis of actin filaments detected in the K5/K14_1 ghost cells served as internal quality control for the sample preparation and the acquired cryo-EM data. Actin filaments were detected around keratins and analyzed independently. (A) Representative 2D classes of F-actin segments of 36 nm length. (B) 3D refined structure of an in vivo assembled actin filament with a resolution of 6.1 Å. Individual α-helices can be recognized. (C) Fourier shell correlation (FSC) plot of the structure shown in (B). The plot shows the unmasked (green), masked (blue), phase randomized (red), and masking-effect corrected (black) FSC curves. The resolution at which the gold-standard FSC curve drops below the 0.143 threshold is indicated.