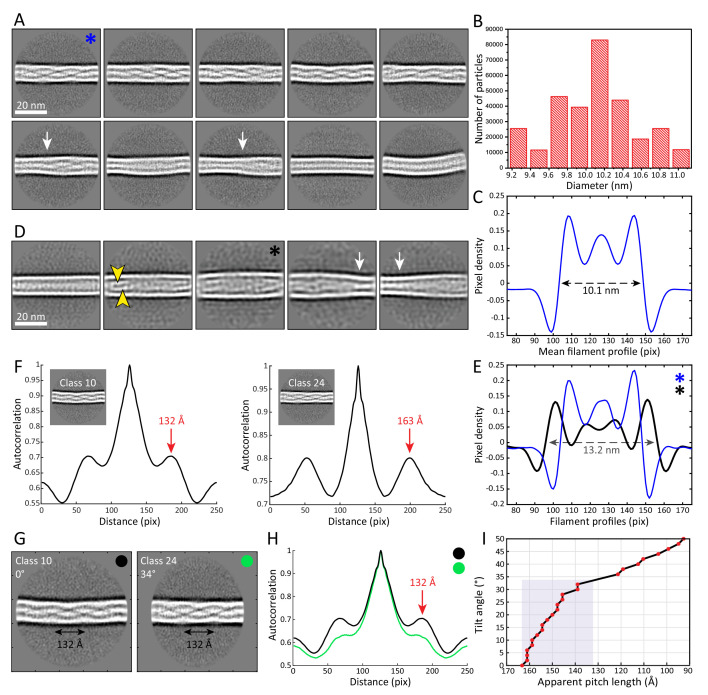
Figure 2. The architecture and heterogeneity of keratin filaments.
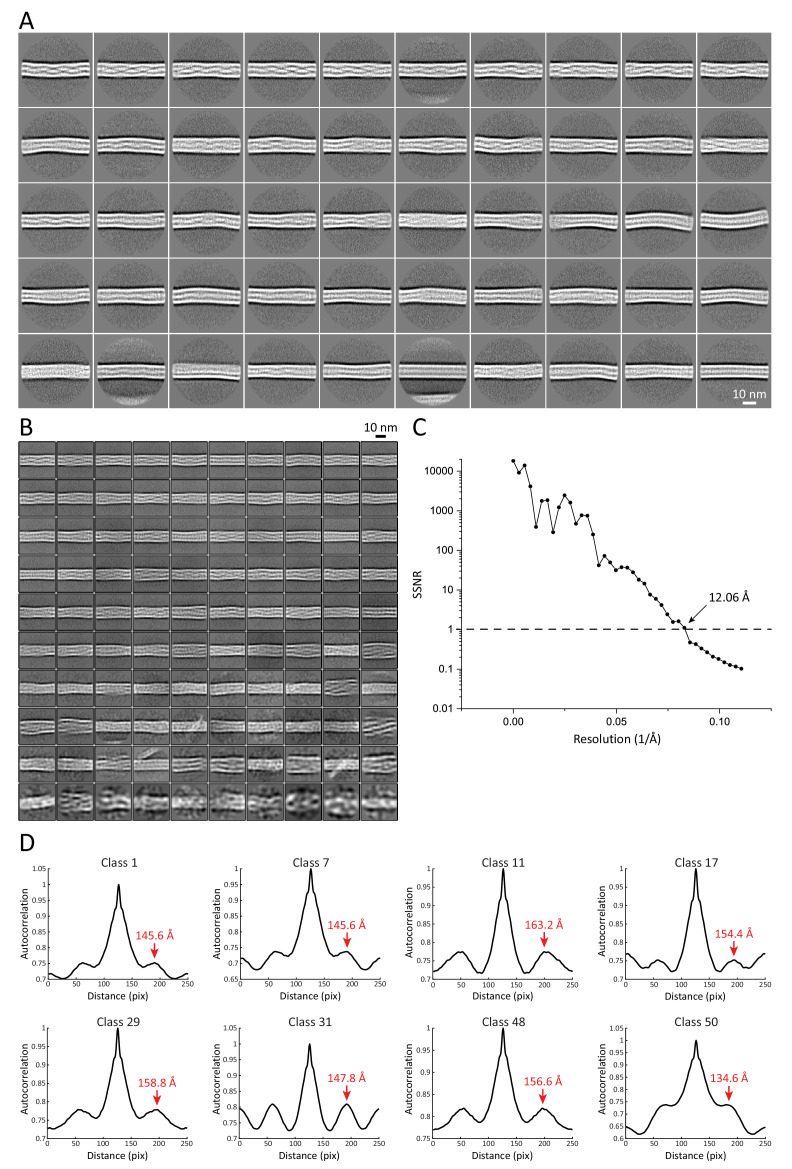
(A) Ten of the most populated 2D class averages of keratin segments. High electron density is shown in white. Arrows indicate transition regions between helical and straight-line patterns. In total, 50 classes containing keratin segments (n=305,495) were collected (Figure 2—figure supplement 1A). (B) Distribution of filament diameters as measured in 50 2D class averages (Figure 2—figure supplement 1A). On the y-axis, the number of individual particles that constituted the 2D classes is plotted. (C) Mean intensity line-profile through all classes used in (B). The mean filament diameter (10.1 nm) is indicated and was measured between the zero-crossings of the curve. (D) Subset of keratin class averages showing larger filament diameters. Two individual filamentous densities are often detected within a filament (yellow arrowheads). Additionally, transition regions between thinner and thicker filament regions are detected (white arrows). (E) Intensity line-profiles through a narrow and a wide class indicated by blue and black asterisk (in (A) and (D)), respectively. Diameters of 10.1 nm and 13.2 nm (arrow) were detected. (F) Autocorrelation spectra of the displayed keratin classes (insets). Peaks of the autocorrelation function corresponding to the distance between repetitive elements along the filament (pitch) are indicated (arrows). (G) To show that out-of-plane tilting of KIFs can shift the autocorrelation peaks, Class 24 was tilted in silico by 34°, while Class 10 is untilted. The apparent pitch of both classes is indicated. (H) Autocorrelation spectra of the classes shown in (G). After tilting of Class 24 by 34°, both classes show an autocorrelation peak at the same marked position, an indicator that filament tilting might be the reason for the different pitches observed in the 2D classes. Green and black dots indicate which curve belongs to which class in (G). (I) Dependence of the apparent pitch length (autocorrelation peaks) on the filament tilt angle, measured by tilting Class 24 from 0° to 50° and calculating corresponding autocorrelation spectra. The gray area indicates the range of pitches found in keratin 2D classes.


