. 2021 Jul 29;10:e70307. doi: 10.7554/eLife.70307

Figure 4. Multiple protofilaments and an internal electron dense core are canonical components of keratin filaments.

(A) Cross-section views of keratin filaments detected within the cryo-EM micrographs of ghost cells. An electron dense core is visible in the center of the keratin tube. Scale bars: 25 nm. (B) Zoomed-in view of the area boxed in (A). The cross section view reveals an internal core surrounded by six protofilaments as constituents of the tube (yellow arrowheads). (C) A surface rendered tomogram of a ghost cell was rotated in order to show the modulation of the keratin filaments within the ice layer (n=44). The three-dimensional keratin network is visualized (light blue). The level of the support is shown as a gray colored slice. Tomographic slices through vertically oriented filaments showing cross section views are indicated by boxes. (D) - (E) 7 nm thick xy-slices of the areas indicated in (C), showing KIFs as tube-like structures with a central density. Individual protofilaments can be identified. Scale bars: 10 nm. (F) A 2D class average of cross-section views extracted from individual regions of vertically oriented filaments (n=19), revealing the six individual protofilaments constituting the keratin filament tube (yellow arrowheads). (G) Low-resolution 3D model indicating the overall dimensions of a keratin filament and the presence of the central density. The structure was calculated template-free by randomizing the rotation angle of extracted 55 nm long keratin segments. Left: Side view. Right: Tilted cross section view revealing internal electron dense core.

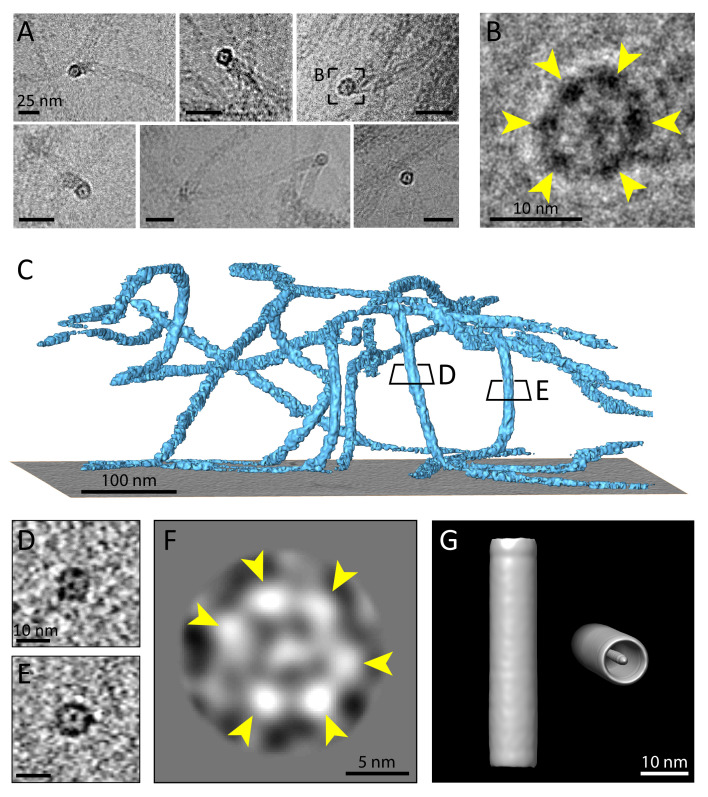
Figure 4.

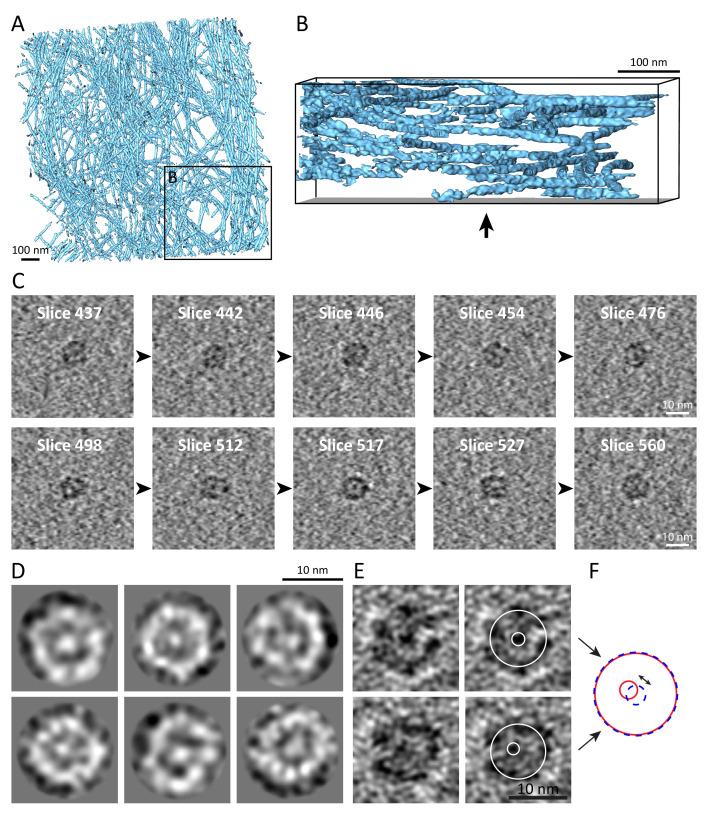
Figure 4—figure supplement 1. Keratin filaments show a unique flexibility and contain a central density.

Figure 4—figure supplement 1.

(A) Surface rendering of a tomogram of the vimentin network (blue) in a mouse embryonic fibroblast (MEF) ghost cell. The vimentin network shows reduced flexibility in comparison to keratin filaments, as vimentin filaments span less through the height of the tomographic volume. No cross-section views could be detected in 225 vimentin tomograms that were acquired. (B) Rotated view of the area boxed in (A), showing a side view of the vimentin network that reveals less fluctuations through the height of the tomogram volume when compared to keratin filaments (Figure 4C), although the tomograms have a comparable thickness. The arrow indicates the viewing direction from (A). (C) Sequential 7 nm thick xy-slices through two sub-tomograms containing single keratin filaments in cross section views. The top and the bottom row show different filaments. Cutting through these filaments emphasizes the variable appearances detected in different slices and allow the identification of more or less protofilaments, respectively. All slices reveal the internal electron dense core. Scale bars: 10 nm. (D) 2D class averages of CTF-corrected keratin filament cross-section views. Individual protofilaments in the ring and an electron dense core can be identified. (E) Two cross section views, representing 4.2-nm-thick slices along a single filament. The keratin filament (labeled with E in Figure 4D) was rotated in silico to a precise cross section orientation and projection images were calculated. On the right, the filament tube and the position of the central density are marked by white circles. (F) Schematic representation of the filament tube and the position of the central density in the filament cross-sections seen in (E). While in the upper panel of (E) the central density lies precisely in the center of the tube (red circles), in the lower panel of (E) the central density is shifted toward one side of the filament (blue dashed circles). The shift is evident in the overlay (double arrow).