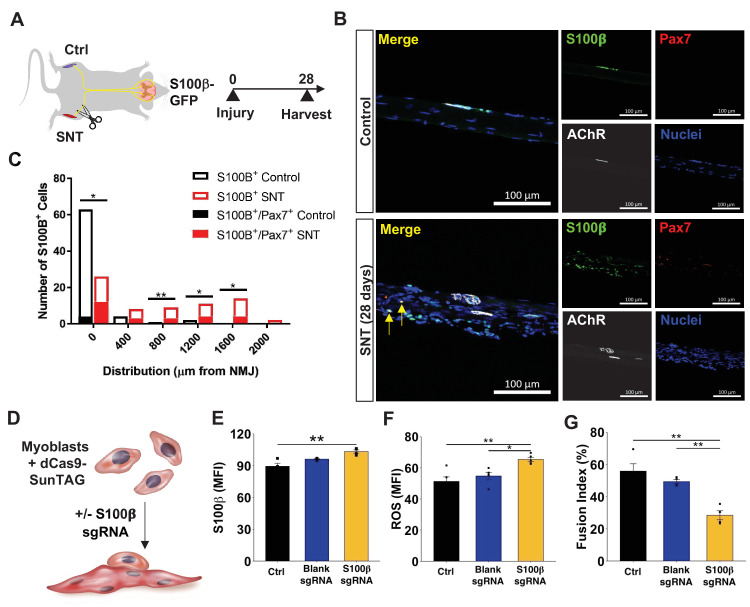
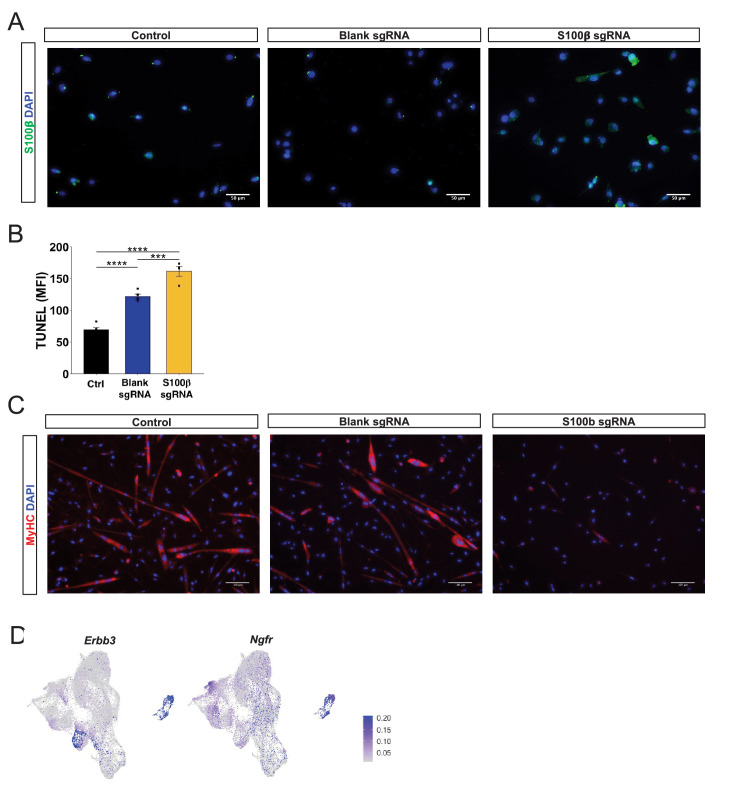
Figure 6. Mislocalization of S100β signaling from denervation promotes muscle stem cell maladaptation.
(A) Schematic of S100β-GFP mice administered sciatic nerve transection (SNT) on one limb and the other limb acts as a control (Ctrl). (B) Representative immunofluorescence z-stack images of isolated muscle fibers from young uninjured and S100β-GFP transgenic mice administered SNT. Myofibers/myobundles are stained with Hoechst33342 (blue), Pax7 (red), α-bungarotoxin (white), and S100β-GFP (green). (C) Euclidean distance of S100B+ and S100B+/Pax7+ cells from the neuromuscular junction (NMJ) in tibialis anterior (TA) muscles from uninjured controls and SNT muscles. n=70 S100B+ cells were quantified on single myofibers from four different mice. *p<0.05, **p<0.01 between groups for S100B+ cells using two-tailed t-test with Holm multiple testing corrections. No statistical significance between groups for S100B+/Pax7+ cells. (D) Schematic of transcriptional activation system in primary myoblasts using CRISPR-dCas9-Suntag and short guide RNA (sgRNA) targeted to S100β. (E) Quantification of mean fluorescent intensity (MFI) of S100β immunofluorescent staining in untransfected cells (Ctrl) and cells transfected with an empty vector (blank sgRNA) or an S100β sgRNA-containing plasmid. Sample sizes were four culture wells, each with >100 cells. **p < 0.01 by one-way ANOVA and Tukey post hoc test. (F) Quantification of MFI from reactive oxygen species (ROS, CellROX) for Ctrl cells and cells transfected with blank sgRNA and S100β sgRNA. Sample sizes were five culture wells, each with >100 cells. *p < 0.05 and **p < 0.01 by one-way ANOVA and Tukey post hoc test. (G) Quantification of fusion index for Ctrl cells and cells transfected with blank sgRNA and S100β sgRNA, then allowed to differentiate for 3 days. Fusion index was calculated as number of nuclei in myotubes/total number of nuclei. Sample size was four culture wells, each with >100 nuclei. **p < 0.01 by one-way ANOVA and Tukey post hoc test.


