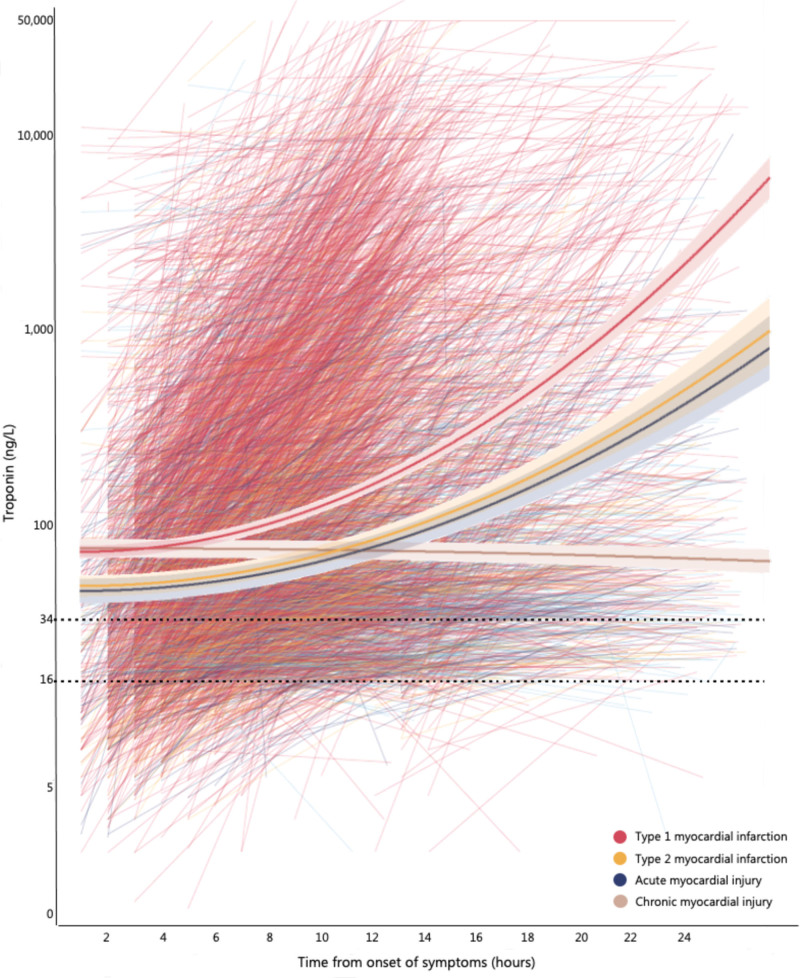
Figure 3.
Kinetics of high-sensitivity cardiac troponin I concentration from symptom onset in patients with myocardial injury and infarction. Spaghetti plot illustrating high-sensitivity cardiac troponin I concentrations in relation to the time of symptom onset in individual patients stratified by the adjudicated diagnosis: type 1 myocardial infarction (red), type 2 myocardial infarction (yellow), acute myocardial injury (blue), and chronic myocardial injury (gray). Plot is restricted to those patients in whom any troponin concentration was above the sex-specific 99th percentile concentration during serial testing within 12 hours of presentation and for whom the time of symptom onset was known (n=3845). Linear mixed-effects modeling was done using random intercepts and random slopes, including quadratic terms for time, with cardiac troponin I as outcome. The output from a linear mixed-effects model incorporating time from symptom onset, troponin, and change in troponin concentration is overlaid for each condition. For each condition, the final model to estimate the trajectory of cardiac troponin I was chosen according to the Akaike information criteria.

