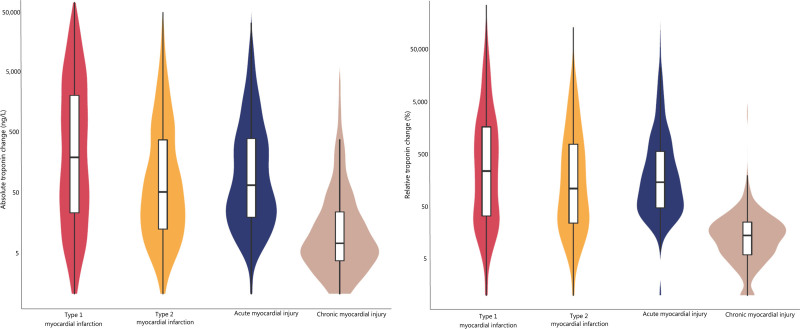
Figure 4.
Absolute and relative changes in high-sensitivity cardiac troponin I concentration on serial testing in patients with myocardial injury and infarction. Violin-density and box-and-whisker plots illustrating the absolute and relative change in high-sensitivity cardiac troponin I concentration on serial testing in patients stratified by the adjudicated diagnosis: type 1 myocardial infarction (red), type 2 myocardial infarction (yellow), acute myocardial injury (blue), and chronic myocardial injury (gray).

