Figure 2.
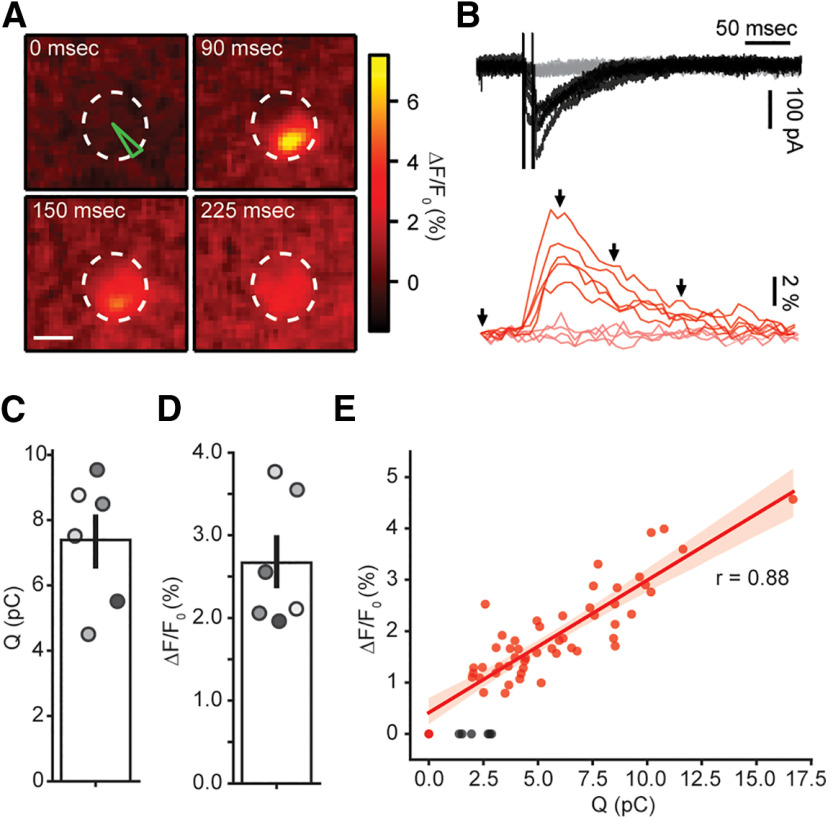
Efferent fiber electrical stimulation evokes localized Ca2+ signals in OHCs. A, Sequence of images showing the localized Ca2+ increase in an OHC following efferent fiber stimulation. Scale bar: 5 μm. B, top, Representative whole-cell current traces during doble-pulse efferent electrical stimulation at 100 Hz (Vh = −100 mV). Black traces represent those trials where an eIPSC was detected after the stimulus artifact (failures, in gray). Bottom, Representative Ca2+ transients taken at the ROI indicated in green on panel A, for the same trials shown on the top panel. Red traces correspond to trials were an IPSC was detected and failures in pink. C, D, Mean charge (C) and ΔF/F0 (D) for successful efferent fiber stimulation trials. Bar plots are mean ± SEM. E, Size of Ca2+ transients as function of charge during efferent stimulation trials in a representative OHC. Black dots represent successful IPSC events with no detectable fluorescence signal.

