Figure 4.

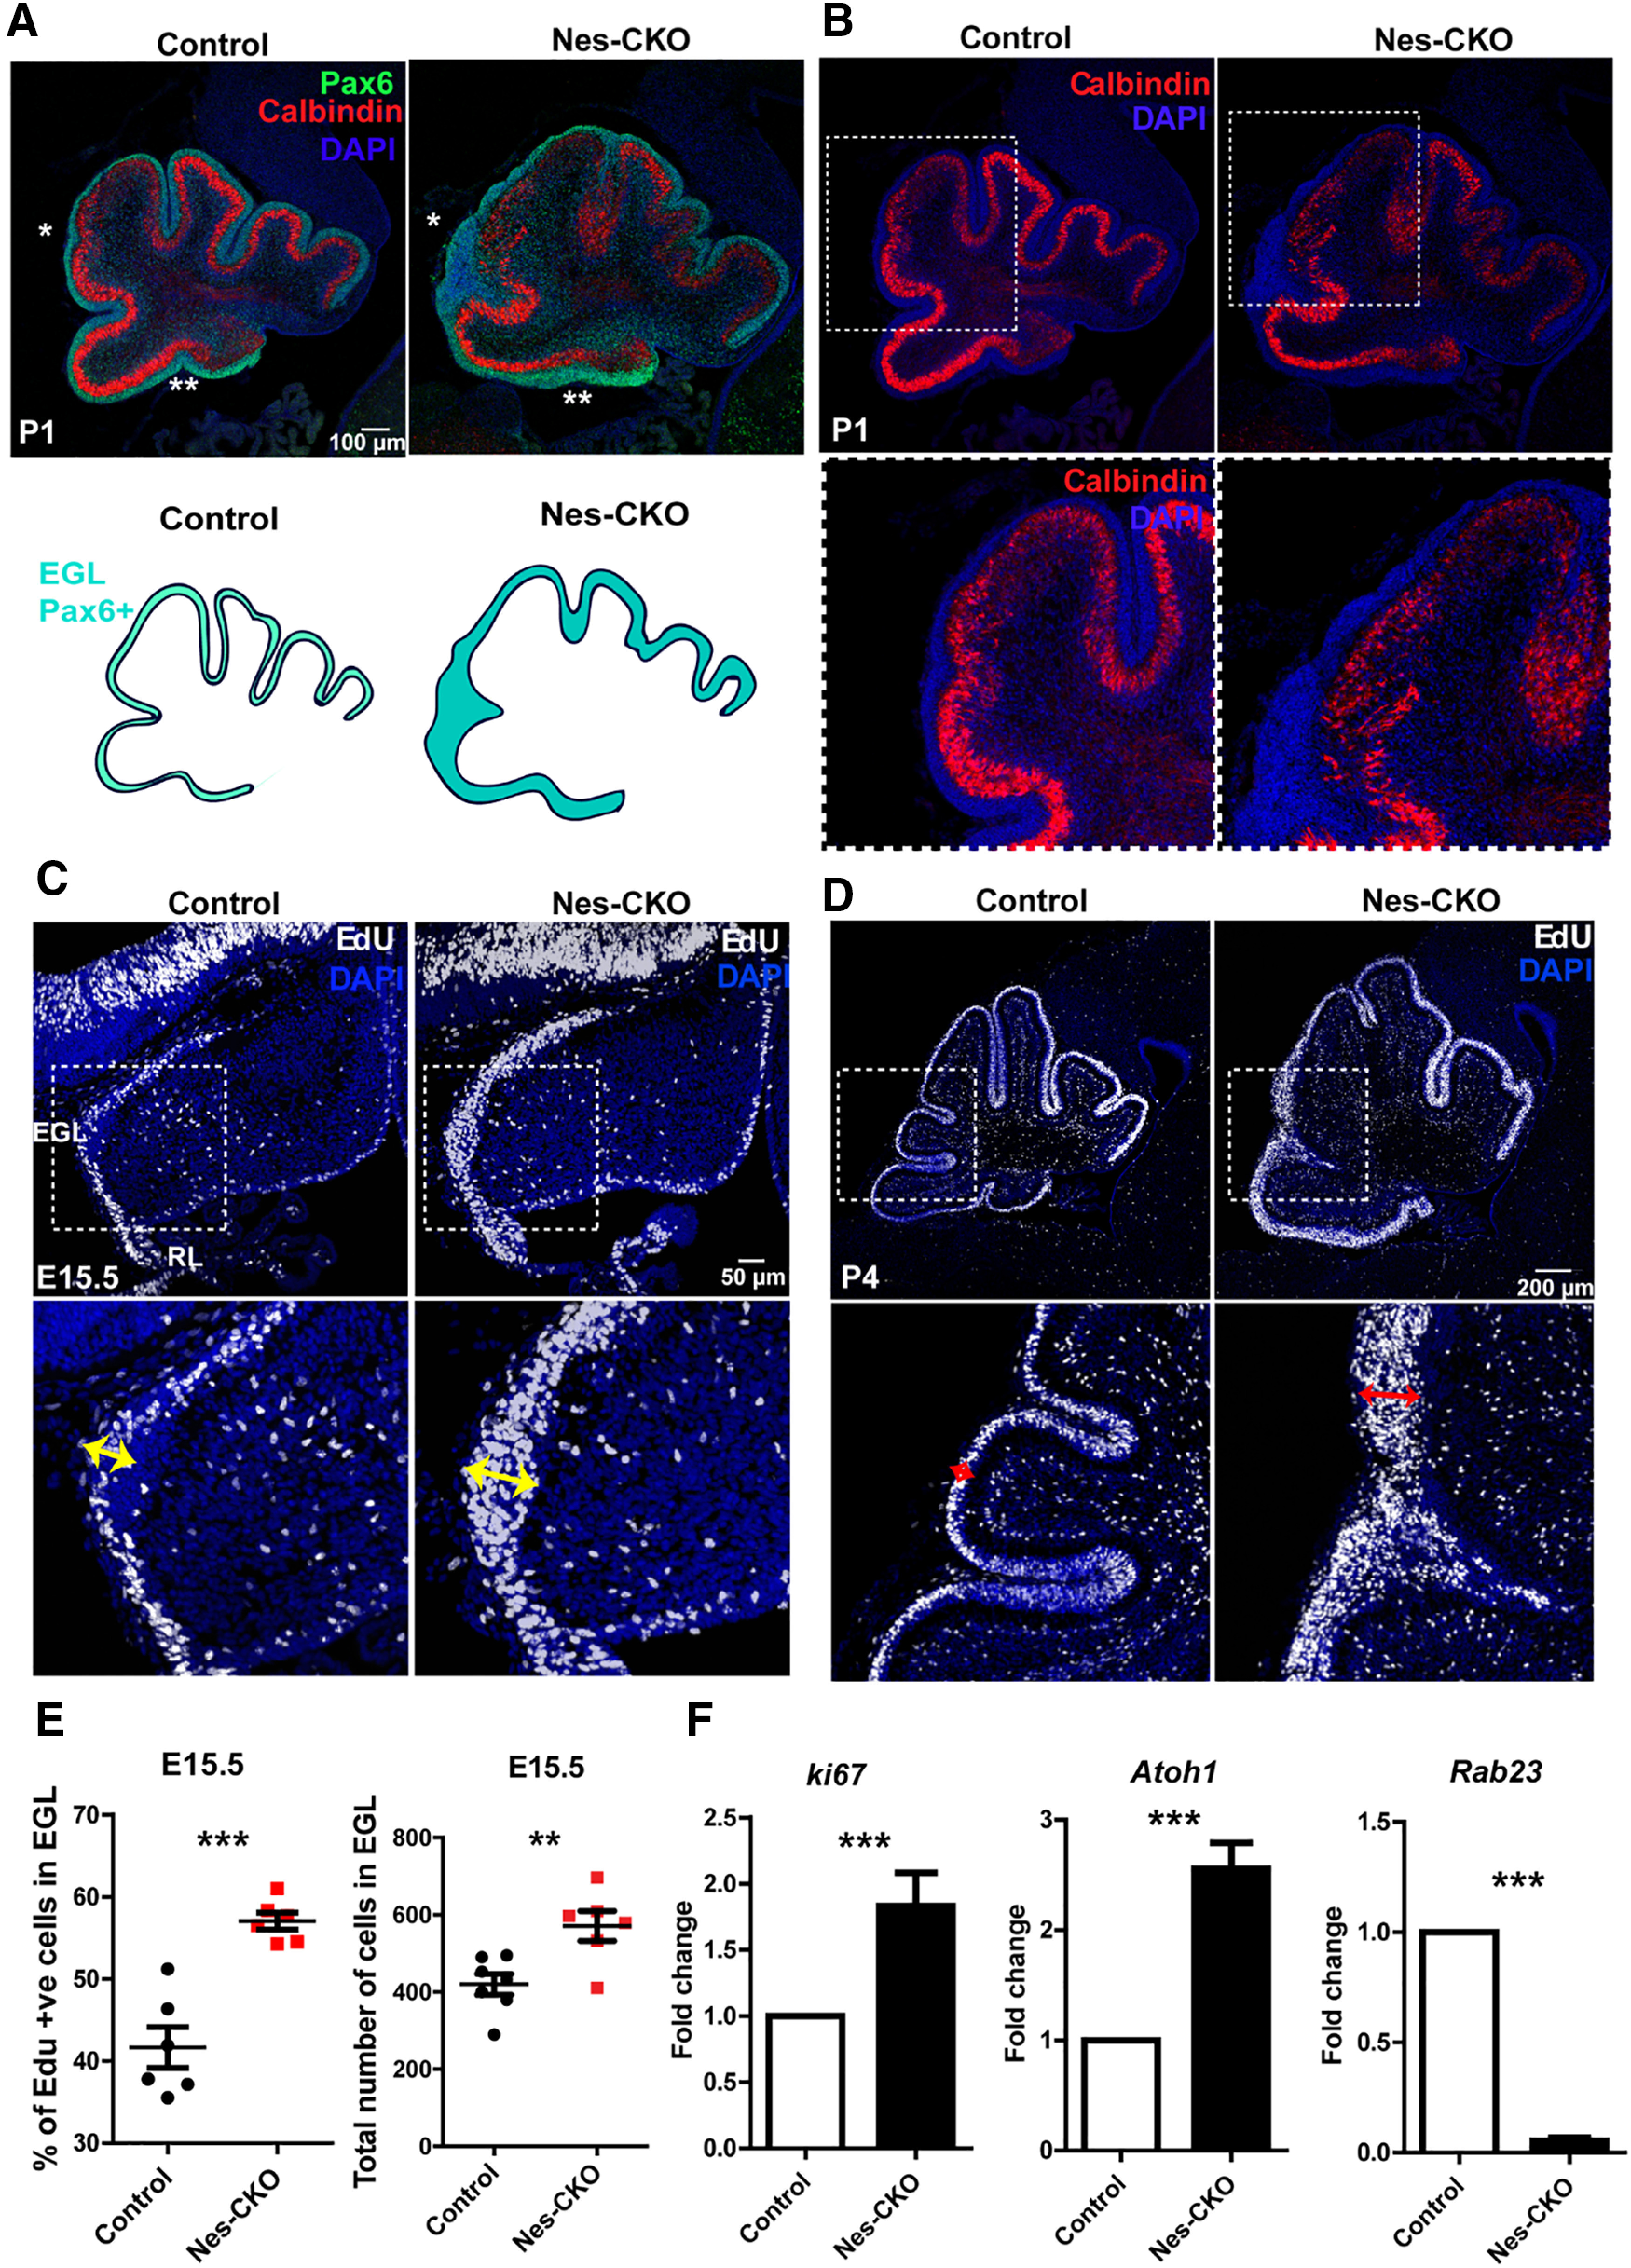
Rab23-deficient cerebellum exhibited thickened EGL and elevated GCP proliferation. A, B, Representative images showing co-immunostaining of Pax6 (green) and Calbindin (red) on P1 sagittal sections of cerebellum to illustrate the GCPs and Purkinje cells layers. Asterisks show a thickened EGL layer in Nes-CKO cerebellum compared with the control. C, D, Representative images showing 2-h EdU-labeled dividing progenitors in the E15.5 (C) and P4 (D) cerebellum. Double headed arrows highlight expanded pools of dividing cells in the Nes-CKO EGL as compared with the control counterparts. E, Graphs depict quantification of the percentages, and the total numebr of 2-h Edu-labeled proliferative cells in the EGL at E15.5. Two to three sections (∼100 μm apart) of the cerebellar primordium were counted for each animal. Control, n = 3; CKO, n = 3. Statistical significance, unpaired Student's t test; ***p ≤ 0.001, **p ≤ 0.01. Error bars depict ±SEM. F, Graphs illustrating the fold change of the gene expression levels of E15.5 cerebellar tissues quantified by real-time QPCR. Control, n = 4; CKO, n = 4. Nes-CKO values were normalized to its respective control group. Statistical significance, unpaired Student's t test; ***p ≤ 0.001. Error bars depict ±SEM.
