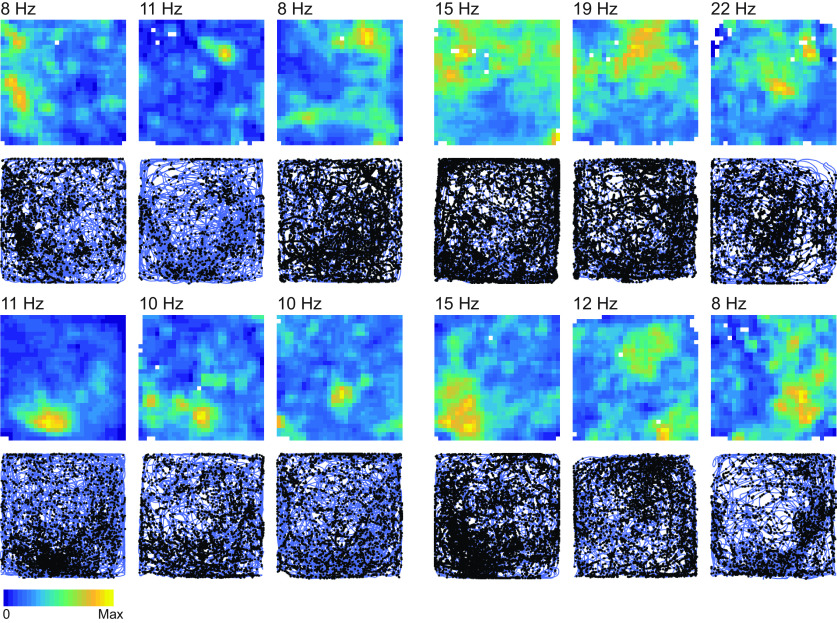
Figure 2.
Example cells. Examples of spatial representations in 12 OFC neurons are shown. Heat maps show firing rate maps constructed by dividing the enclosure into a 30 × 30 grid of bins and computing the session average firing rate for each location. The maximum firing rate of each cell is plotted near the upper left corner of firing rate maps. Regions of the enclosure that rats did not spend at least 0.2 s in over the course of the 30 min session are represented with a white pixel. Below each firing rate map, a corresponding plot of the location of the rat (blue) and the location of each action potential (black dots) is shown. Max, Maximum.

