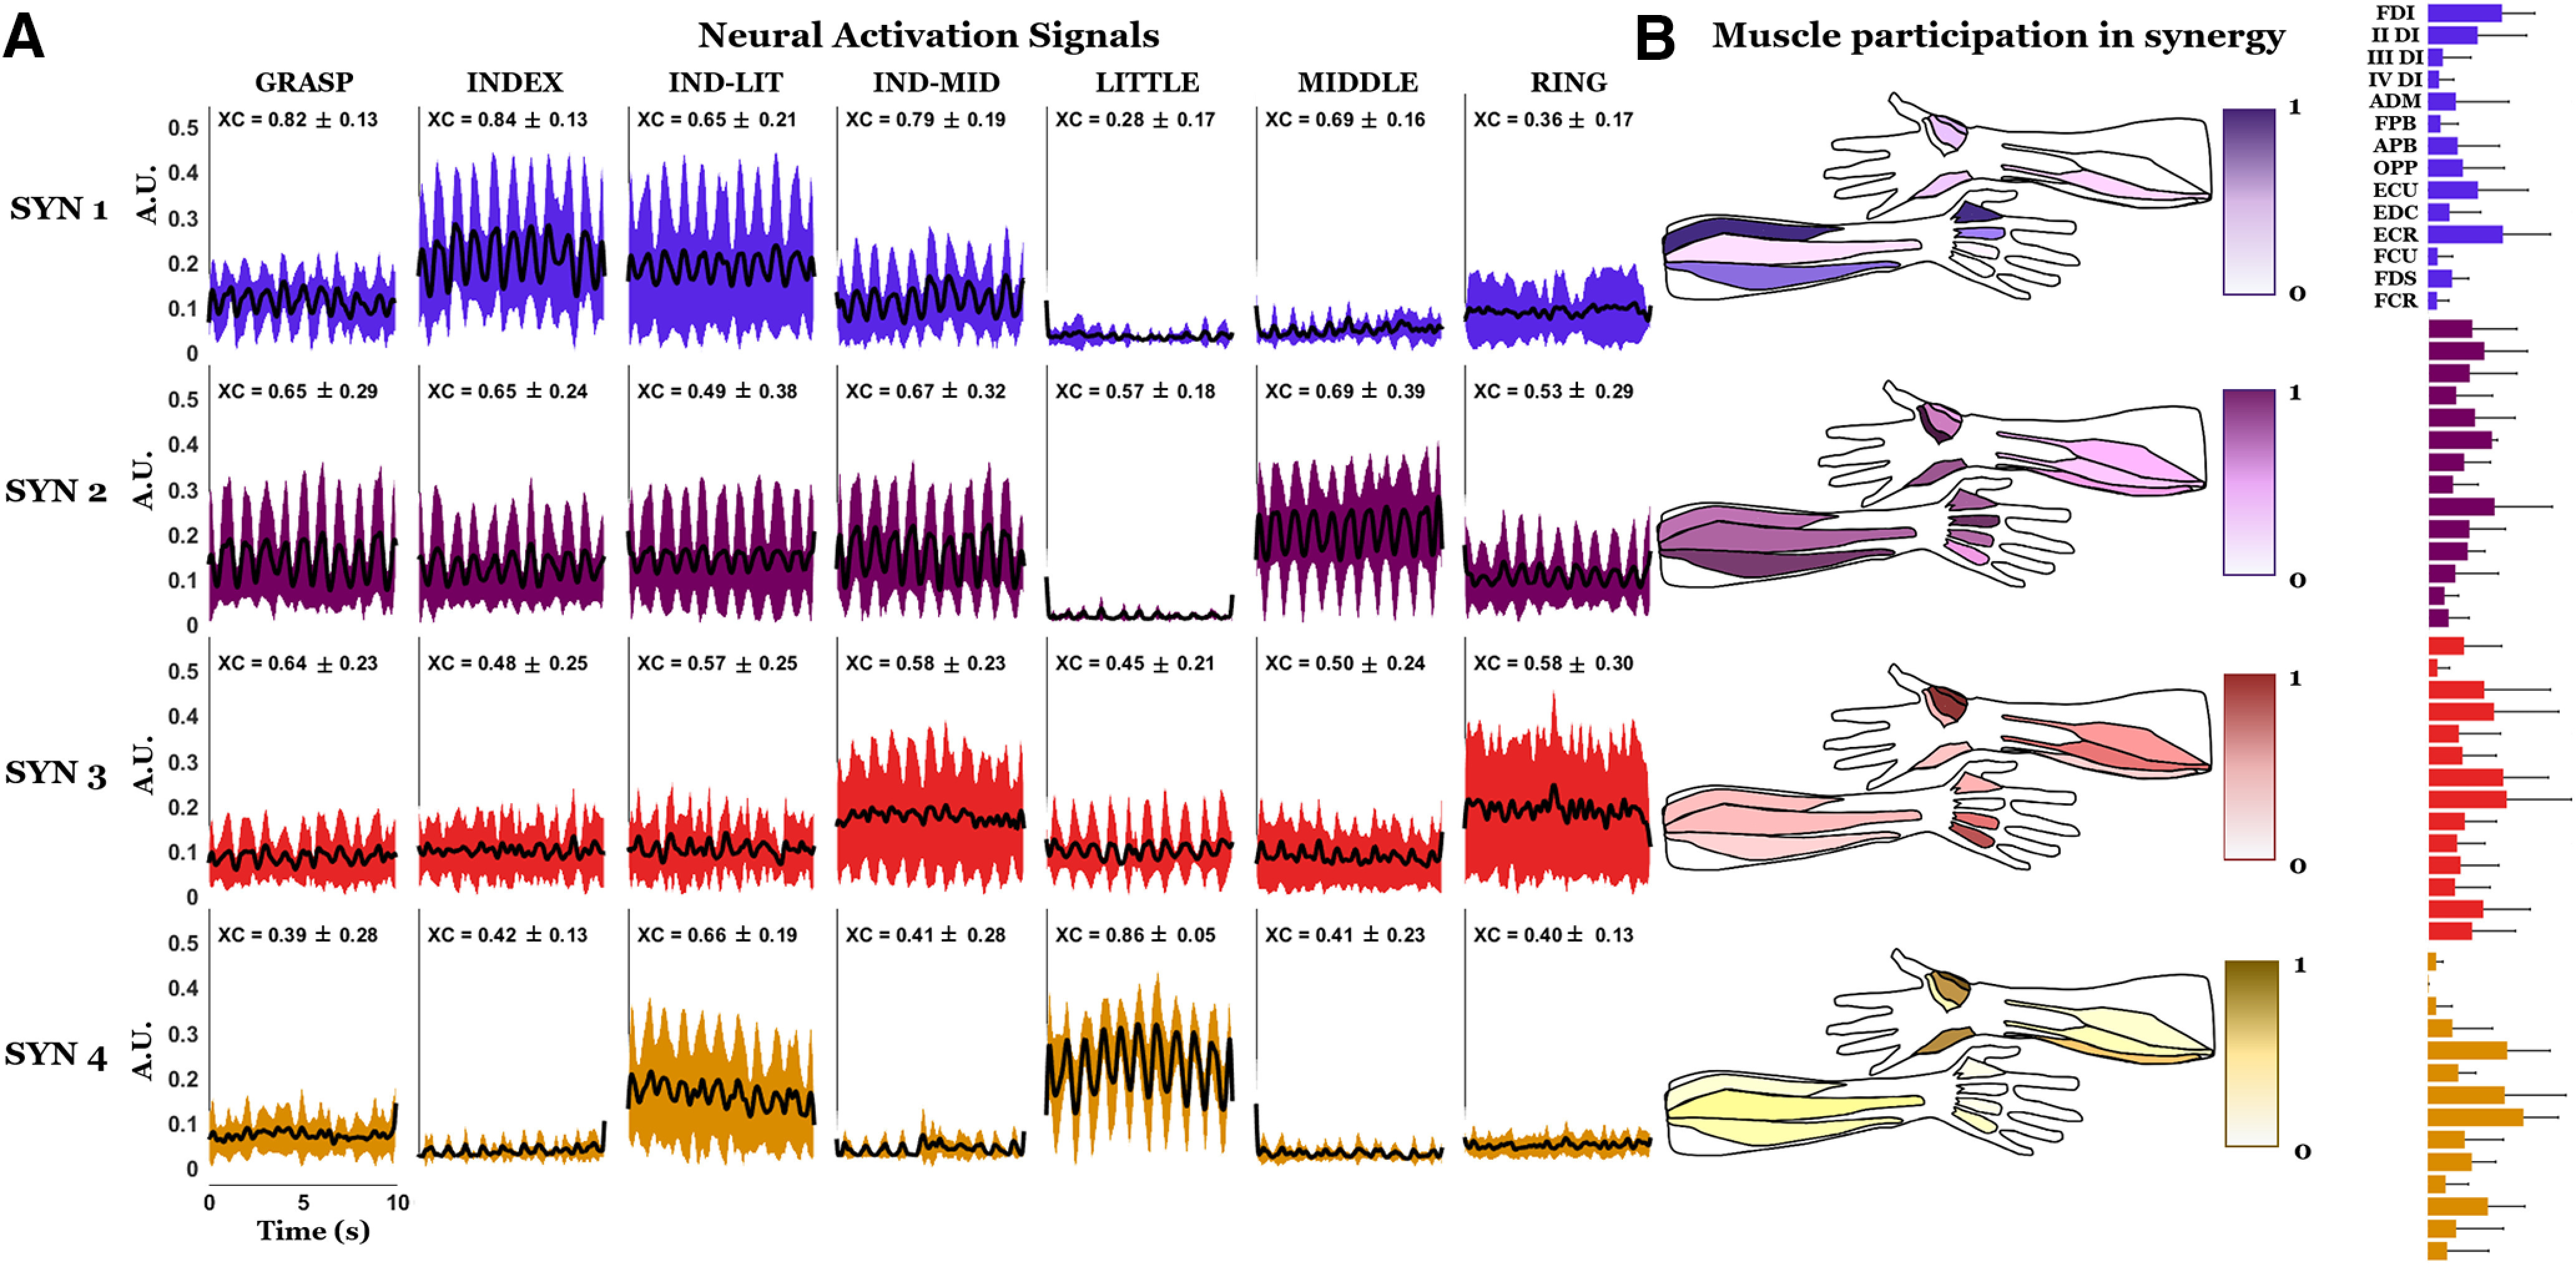
Figure 9.

Activation signals and anatomic maps of the motor neuron synergy weights. A, First four motor neuron synergies and their cross-correlation peak (XC) with grip force. B, Anatomical maps. On the right of each anatomic map, the bar graph representation of the mean and the SD of the synergy weights is also provided. Data are shown in the same format as Figure 8.
