
Figure 6.
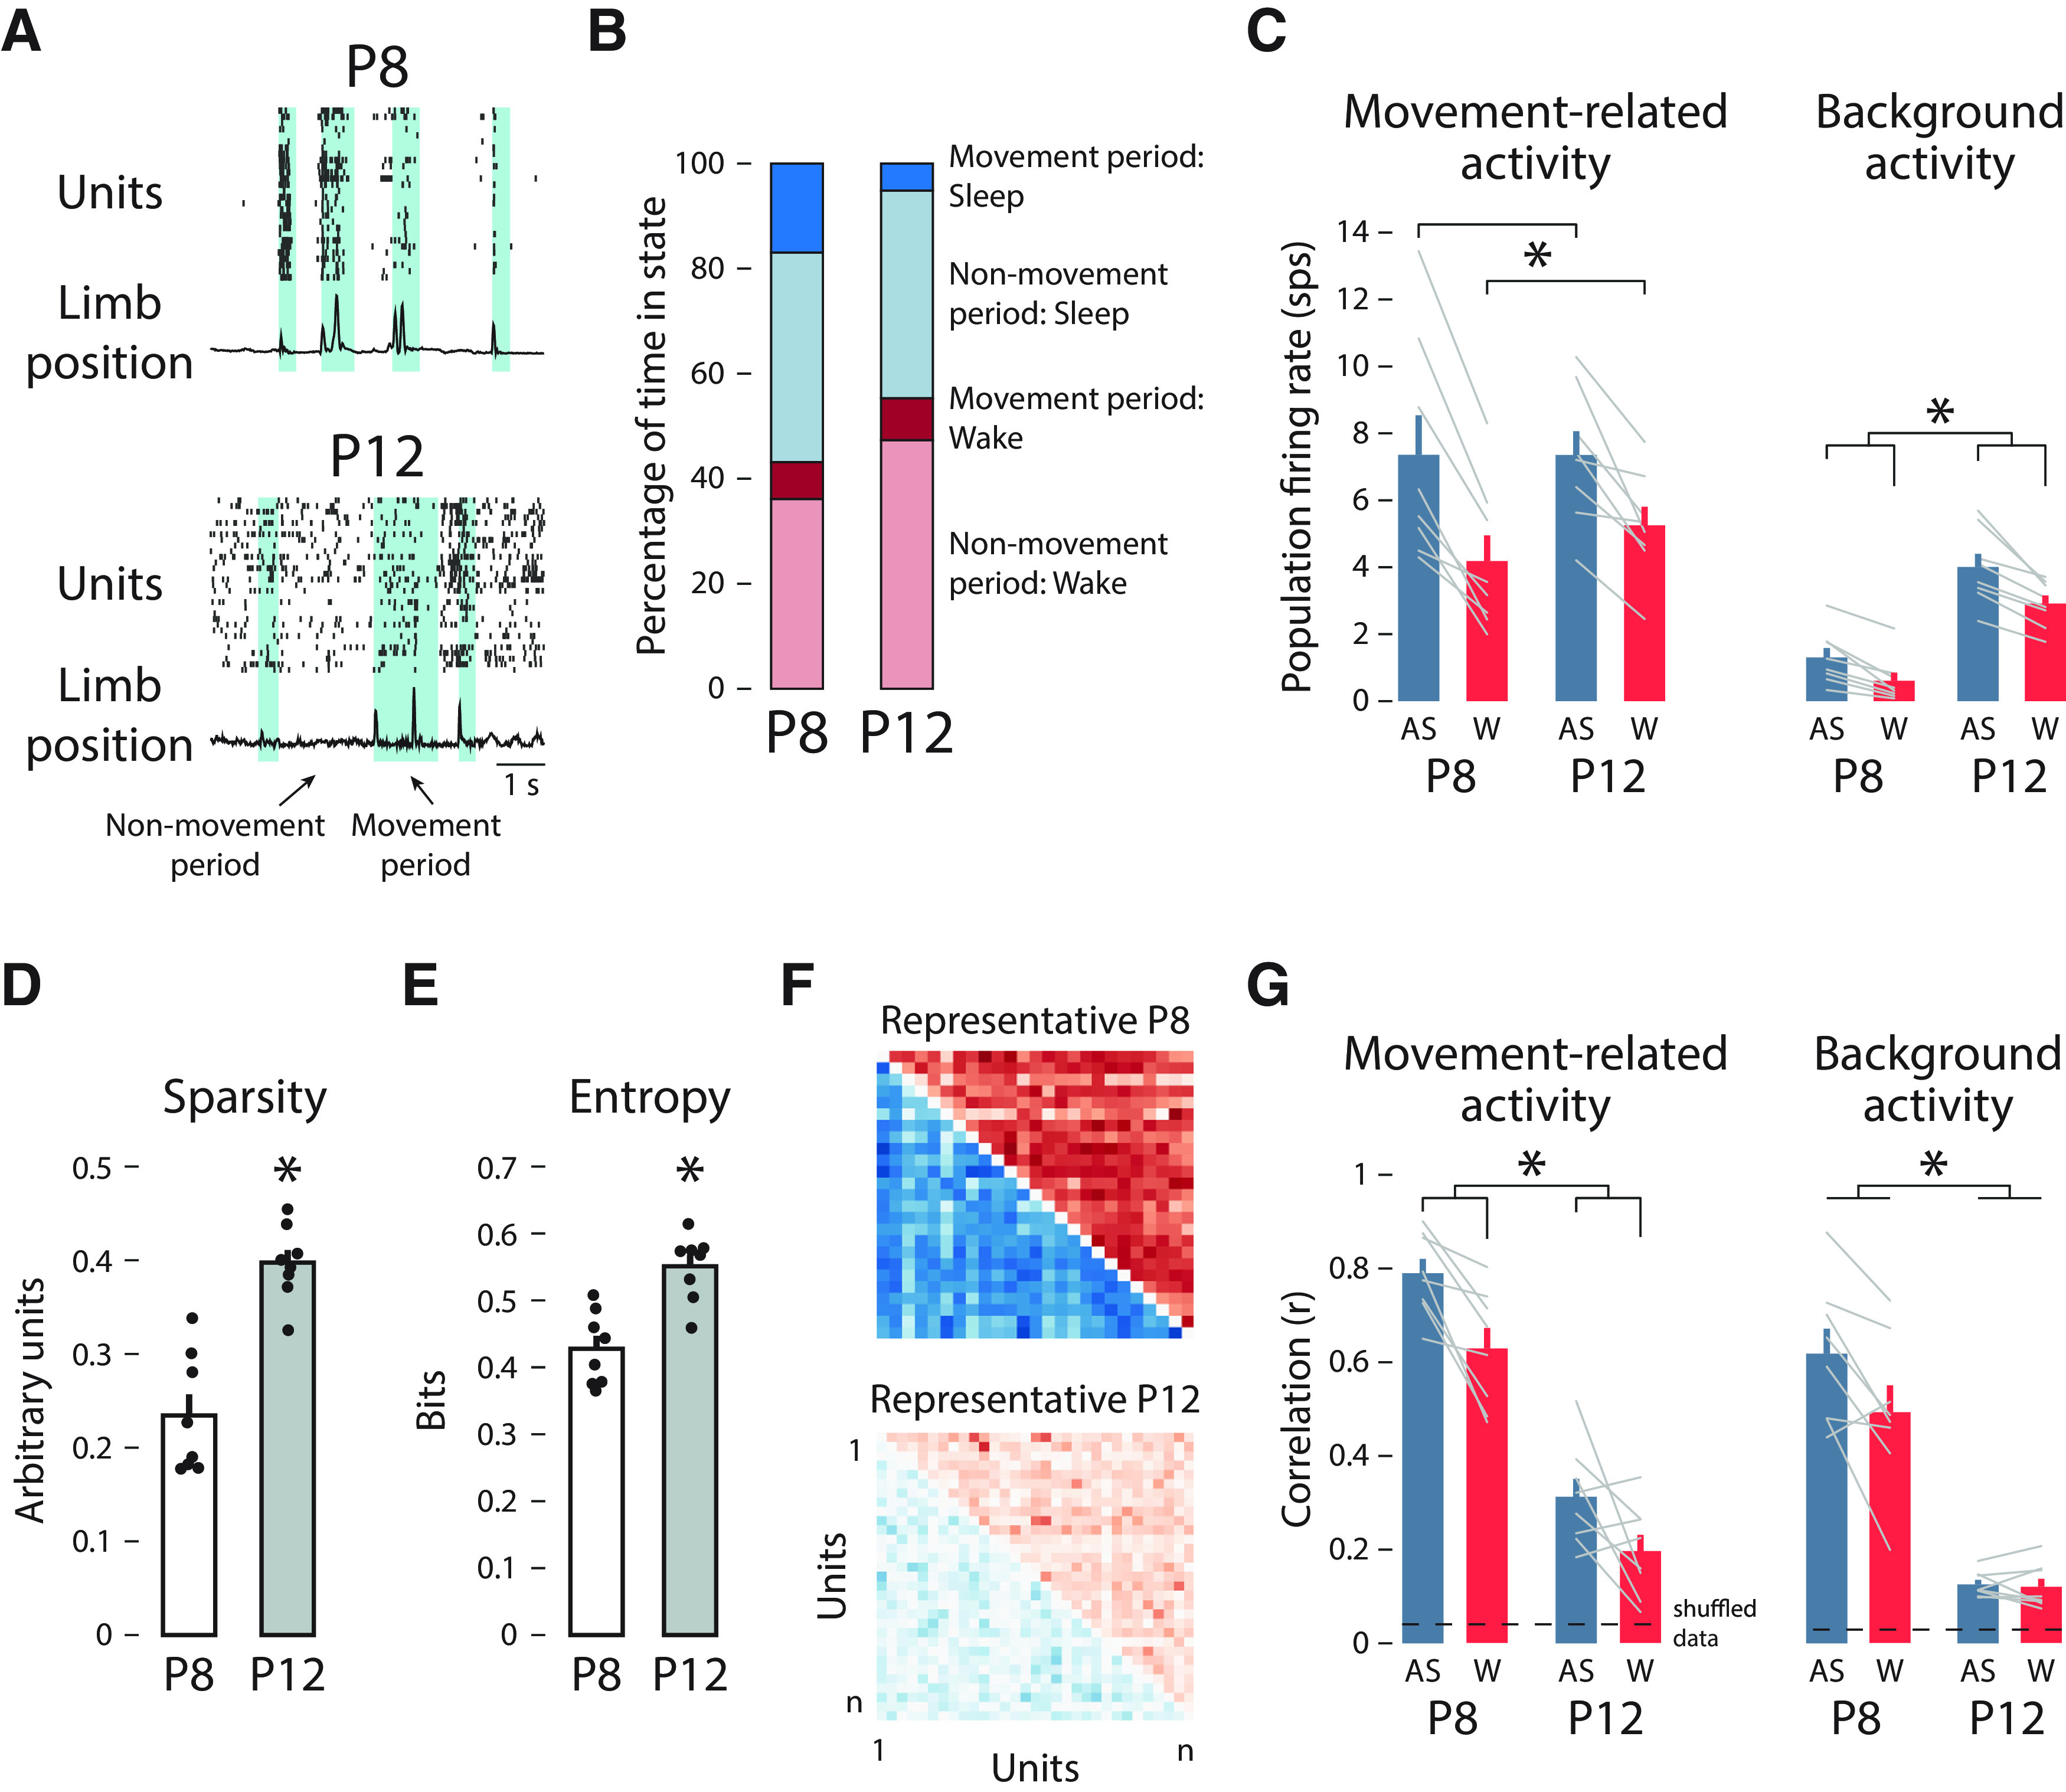
Population spiking activity decorrelates between P8 and P12. A, Population spiking activity and limb position from a representative P8 (top) and P12 (bottom) rat are shown. A spike raster (each row represents one unit) and limb position trace (normalized) is shown for each pup. Shaded regions represent movement periods, and the unshaded regions represent nonmovement periods. B, The percentage of time spent in movement or nonmovement periods (movement period (sleep), blue; nonmovement period (sleep), light blue; movement period (wake), red; nonmovement period (wake), light red) is shown for P8 (left) and P12 (right) animals. C, Mean (±SEM) movement-related activity (left-hand plot) and background activity (right-hand plot) firing rate for active sleep (blue) and wake (red) for P8 (left) and P12 (right). Firing rates for each rat are shown as gray lines. Asterisks denote a significant main effect of behavioral state (left-hand plot; p < 0.05) and significant main effects of behavioral state and age (right-hand plot; p < 0.05). D, Mean (±SEM) values of sparsity for P8 (white) and P12 (gray) rats. Black dots show the values for individual pups. The asterisk indicates a significant difference between P8 and P12 (p < 0.05). E, Mean (±SEM) values of entropy for P8 (white) and P12 (gray) rats. Black dots show the values for individual pups. The asterisk indicates a significant difference between P8 and P12 (p < 0.05). F, Representative correlation matrices for each unit–unit pair (x- and y-axes) for a P8 (top) and a P12 (bottom) rat during movement periods. Blue squares indicate correlations during active sleep, and red squares indicate correlations during wake. Darker colors denote higher r2 values. G, Mean (±SEM) correlation coefficient (r) during active sleep (blue) and wake (red) for P8 (left) and P12 (right) animals for movement-related activity (left-hand plot) and background activity (right-hand plot). Correlation coefficients for each rat are shown as gray lines. Dashed horizontal lines indicate 99% confidence interval based on shuffled data. Asterisks represent significant main effects of behavioral state and age (left-hand plot; p < 0.05) and a significant main effect of age (right-hand plot; p < 0.05).