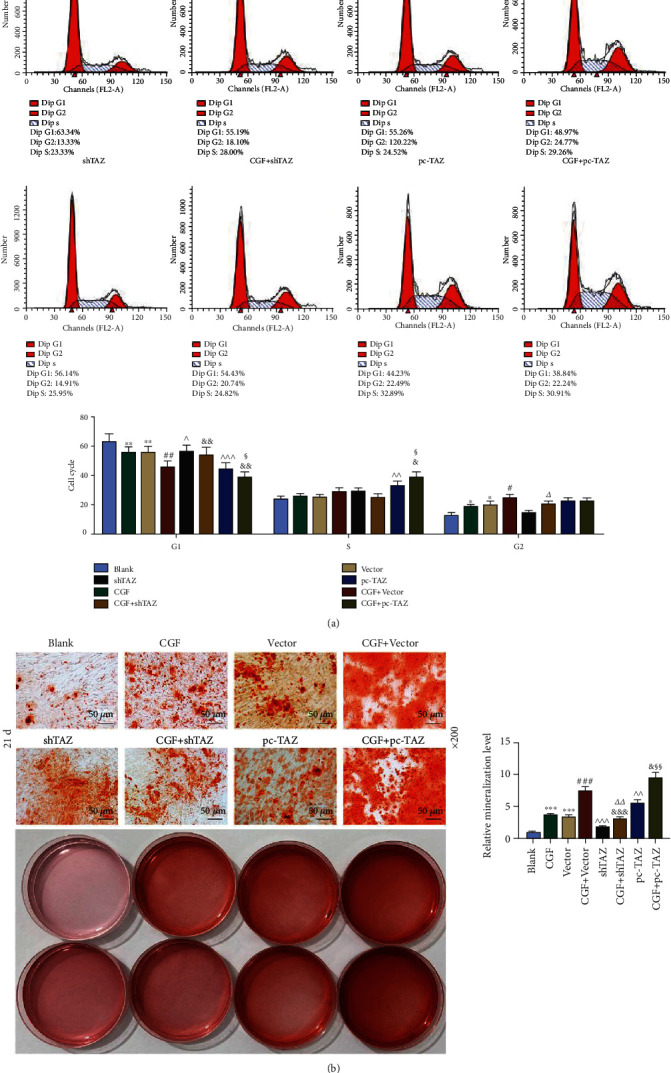
Figure 7.

The effects of CGF fibrin membrane, pc-TAZ and shTAZ on cell cycle and differentiation of coculture. (a) Cell cycle changes were detected by flow cytometry. (b) Alizarin staining was used to identify cell mineralization, under 200 × magnification. Mineral accumulation was quantified. All experiments were performed in independent triplicate. ∗p < 0.05, ∗∗p < 0.01, ∗∗∗p < 0.001 vs. blank; #p < 0.05, ##p < 0.01, ###p < 0.001 vs. CGF; ^p < 0.05, ^^p < 0.01, ^^^p < 0.001 vs. vector; &&p < 0.01, &&&p < 0.001 vs. CGF + vector; △p < 0.05 vs. shTAZ; §p < 0.05, §§p < 0.01 vs. pc-TAZ.
