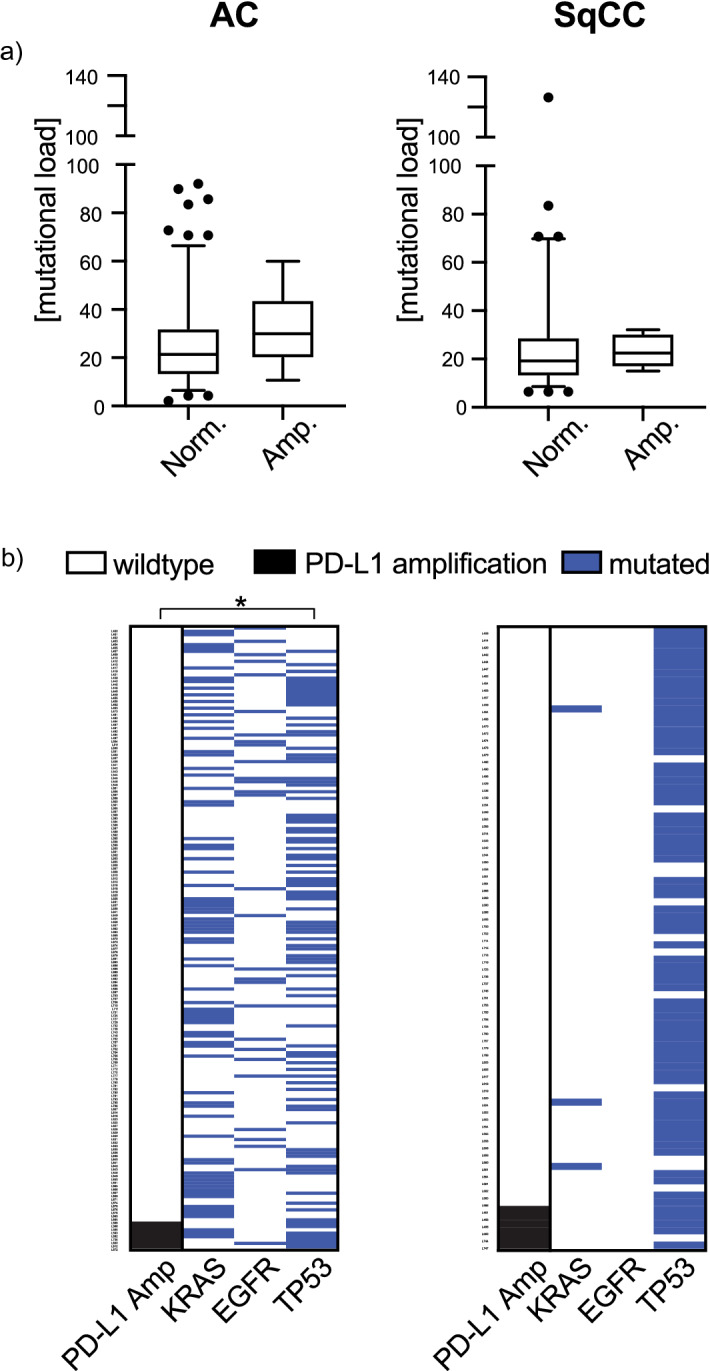
Fig. 2.

a Association of the PD-L1 amplification status with mutational load (synonymous plus non-synonymous) within the adenocarcinoma (AC) and squamouscell carcinoma (SqCC) tumor subgroups of the Uppsala 06 cohort. Box plots indicate the median with the interquartile range and the whiskers represent the 5–95 percentiles. Outliners are represented as dots. b Association of the PD-L1 amplification status (black) with activating driver mutations of the EGFR and KRAS genes as well as mutations of the TP53 gene (blue) are represented as binary heat maps. P-value is based on Fisher’s exact test, two-sided. *p < 0.05
