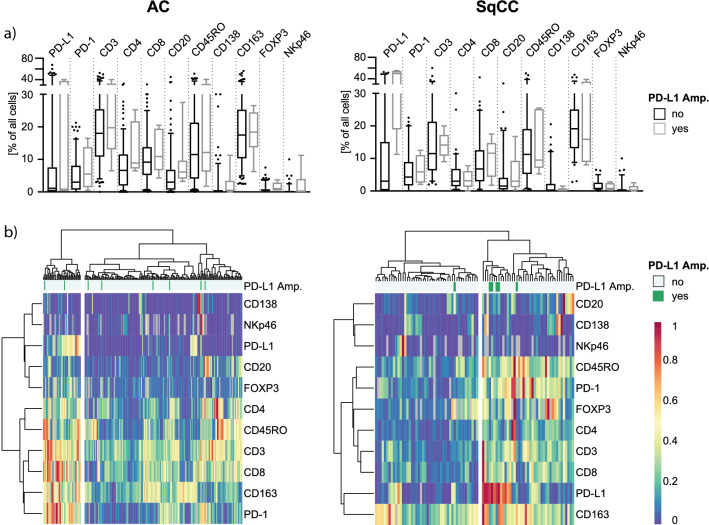
Fig. 3.
a Association of the PD-L1 amplification status with single immune cells counts within the adenocarcinoma (AC) and squamouscell carcinoma (SqCC) tumor subgroups of the Uppsala 06 cohort. Immune cells counts were determined by IHC. Box plots indicate the median with the interquartile range and the whiskers represent the 5–95 percentiles. Outliners are represented as dots. b Hierarchical cluster analysis using Ward’s method and Euclidian distance of the IHC based immune marker annotation and its association with PD-L1 amplification status and tumor histology

