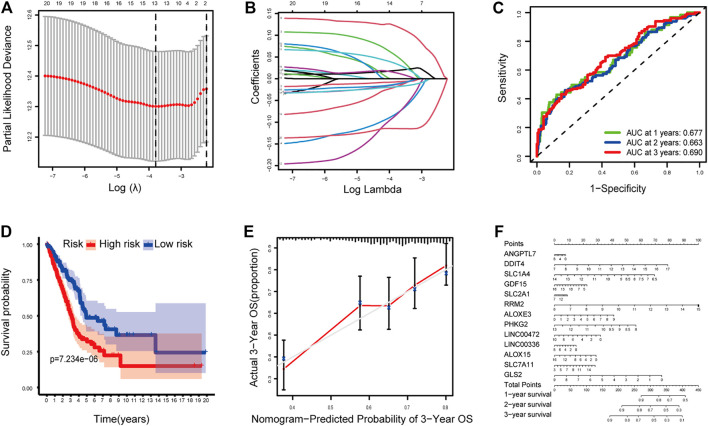
FIGURE 2.
(A–B) Model diagnosis process Lasso regression curves which were constructed by the Ferroptosis-related genes signature. (C) AUC of timedependent ROC curves verified the predicting prognostic performance. (D) Kaplan–Meier curves for the OS of patients in the high-risk group and low-risk group. (E-F) The calibration curves and nomogram. ROC, receiver operating characteristic curve. *p < 0.05.

