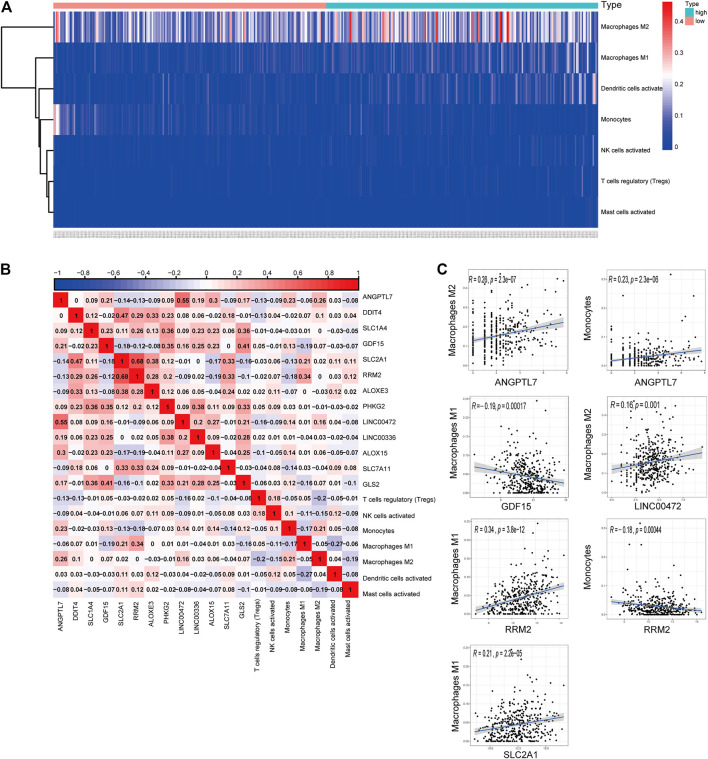
FIGURE 6.
(A) The risk heat map of significant infiltrating immune cells. (B) The result of the co-expression analysis between tumor-infiltrating immune cells and the ferroptosis-related genes signature. (C) ANGPTL7 and M2 macrophages (R = 0.26, p < 0.001), ANGPTL7 and monocytes (R = 0.23, p < 0.001), GDF15 and M1 macrophages (R = −0.19, p < 0.001), LINC00472 and M2 acrophages (R = 0.16, p = 0.001), RRM2 and M1 macrophages (R = 0.34, p < 0.001), RRM2 and monocytes (R = −0.18, p < 0.001), and SLC2A1 and M1 macrophages (R = 0.21, p < 0.001), and these reminded us the relationship between the ferroptosis-related genes and tumor-infiltrating immune cells.

