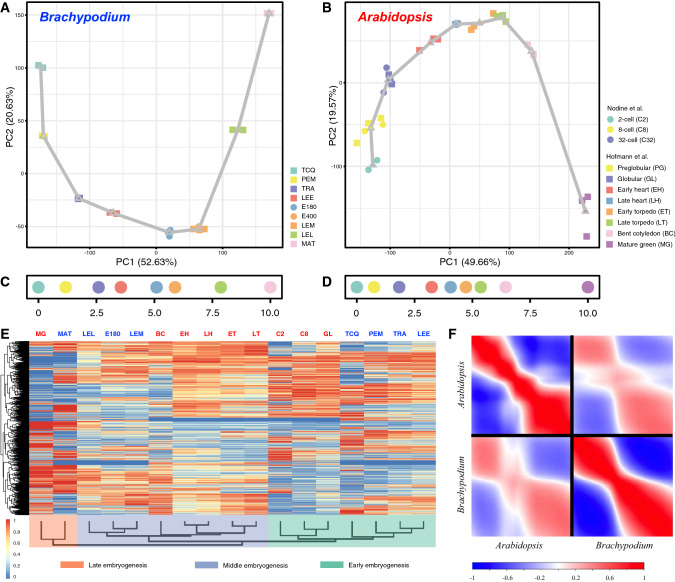
Fig. 3.
Transcriptional dynamics of B. distachyon and A. thaliana embryogenesis. All of the differentially expressed genes were used in the PCA plots to stratify embryonic transcriptomes across stages in Brachypodium (A) and Arabidopsis (B). Each developmental stage was represented using the centroid location in each PCA plot and adjacent centroids were linked using straight lines, forming an expression trajectory. Then, the rank and distance along the developmental trajectory were used to calculate a developmental time units (DTU) value, scaled from 0.0 to 10.0, as a pseudotime metric in each species (C, D). E The hierarchical clustering of the relative expression data of orthologous genes between Brachypodium and Arabidopsis shows broad clustering according to embryogenesis phase (early/middle/late). Stage abbreviations are the same as in the key to (A) and (B). F The intra- and interspecific comparisons of embryonic developmental transcriptomes between Brachypodium and Arabidopsis. The successive stages of embryogenesis (DTU plots from panels C and D) are plotted on both axes of each plot. Species are indicated on each axis. Pearson correlation: positive, red; no correlation, white; negative, blue

