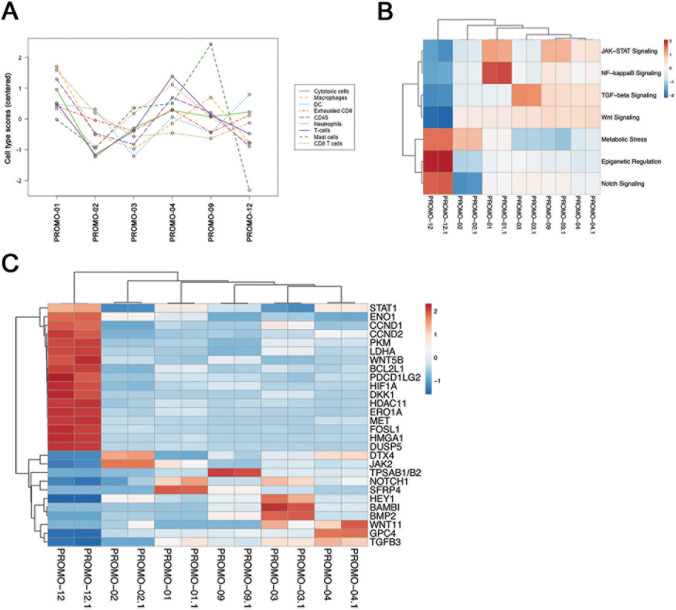
Fig. 4.
Gene expression analysis of tumor samples using the NanoString platform. a Abundance of various cell type populations across different samples. The cell type score is calculated based on cell-type specific gene expression markers. b Pathways showing differential behavior in PROMO-12 compared to the remaining samples. Pathway scores are calculated based on gene expression data using nSolver V4 software and oriented such that increasing score corresponds to increased expression. c Normalized gene expression values of top 28 differential expressed genes involved in these pathways. For both plots, rows are centered and unit variance scaling is applied to rows. Both rows and columns are clustered using correlation distance and average linkage. In b and c, samples were analyzed in duplicate and both duplicates are shown

