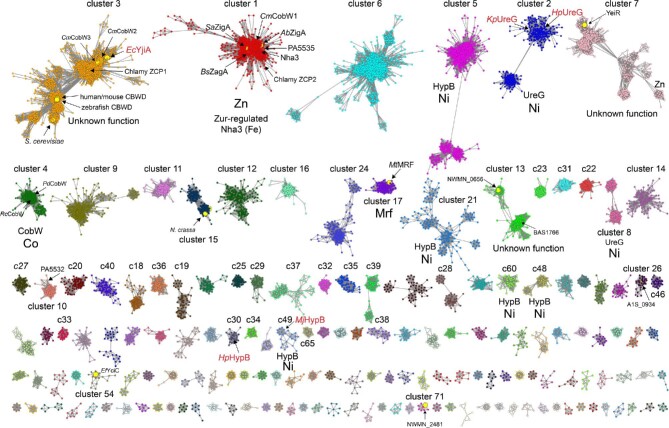
Fig. 4.
SSN of G3E P-loop GTPases assembled from Pfam families PF02492 (cobw) and PF07683 (cobw_c) using A. baumannii ZigA37 as query (see Supplementary Methods). Each node corresponds to proteins with >60% sequence identity over >80% sequence coverage and individual clusters (arranged according to the number of nodes, from left to right, from top to bottom) are separated and colored accordingly. Cluster numbers are ranked according to the sequence cluster count (see Fig. S1 and Table S1) with SSN cluster 1 containing the largest number of sequences. Characterized proteins or genes that encode the indicated protein are highlighted within each cluster, with known functions assigned to each cluster, along with the corresponding cognate metal. Those nodes that harbor known protein structures are highlighted in red text (see Fig. S3 for additional information). The small node grouping in cluster 7 (YeiR) marked ‘Zn’ are derived from candidate Zur-regulated operons in β-proteobacteria. Only SSN clusters with larger than seven (7) nodes are shown here for clarity (see Tables S1 and S2 for a complete listing of all clusters and singletons, and associated uniprot identifiers associated with each).

