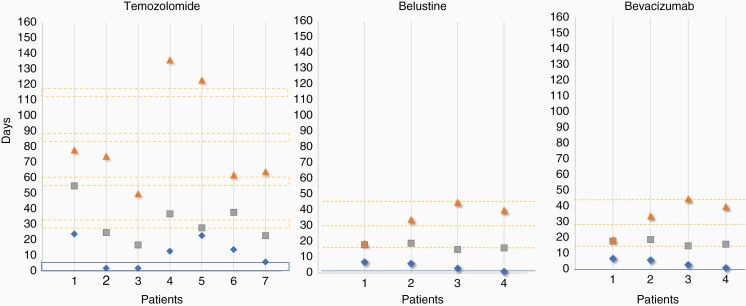
Figure 2.
Oncological treatments delay in COVID-19 symptomatic patients. The x-axis indicates the patients. Chemotherapy agents are indicated on the top of the panels. The y-axis indicates the time in days. The blue diamond indicates the date of COVID-19 diagnosis. The grey square indicates the clinical recovery of COVID-19. The blue line indicates the last chemotherapy cycle. The broken orange line indicates the theoretical date of the next chemotherapy cycle. The orange triangle indicates the first day of chemotherapy after COVID-19.

