Figure 2.
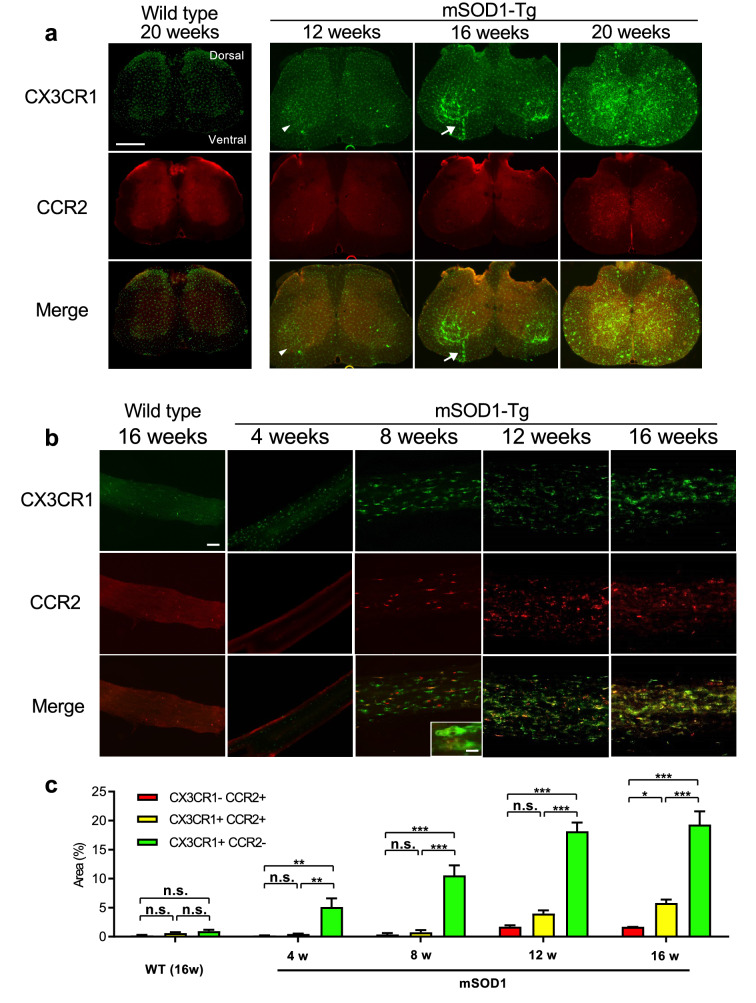
CX3CR1 and CCR2 expression in the lumbar spinal cord and sciatic nerve. (a) Low magnification fluorescence images of CCR2RFP/WT/CX3CR1GFP/WT (non-mSOD1 type) and SOD1G93A/CCR2RFP/WT/CX3CR1GFP/WT (mSOD1-Tg) mouse spinal cord. At 12 weeks of age, CX3CR1+ (green) but not CCR2+ (red) cells were sparsely visible only in the spinal anterior horns (arrowhead). CX3CR1+ cells markedly increased as the disease progressed from 16 to 20 weeks of age, whereas CCR2+ peripheral immunocytes rarely infiltrated at 20 weeks of age. Infiltration of CX3CR1+ cells along the intramedullary lower motoneuron axonal tracts was prominent at 16 weeks of age (arrow). (b) Low magnification fluorescence images of CCR2RFP/WT/CX3CR1GFP/WT (non-mSOD1 type) and SOD1G93A/CCR2RFP/WT/CX3CR1GFP/WT (mSOD1-Tg) mouse sciatic nerves. In the sciatic nerves of a mSOD1-Tg mouse, CX3CR1+ cell infiltrations were visible as early as 4 weeks of age and CX3CR1+CCR2+ cells appeared at 8 weeks of age (pre-symptomatic stage). These infiltrated cells showed a foamy appearance (inset in the 8 weeks merged image). Such inflammatory infiltrates were not seen in non-mSOD1 type mice. (c) The quantitative analysis of CCR2+ CX3CR1− (red), CCR2−CX3CR1+ (green), and CX3CR1+CCR2+ (yellow) areas (%) in sciatic nerves. In SOD1G93A mice, numbers of all types of macrophages (CCR2−CX3CR1+ green, and CCR2+CX3CR1+ yellow macrophages) increased as the disease progressed, whereas CCR2+CX3CR1− red immune cells did not. Scale bars: (a) 500 μm; (b) 50 μm and 10 μm (inset). n.s. = not significant. *p < 0.05; **p < 0.001; ***p < 0.0001.

