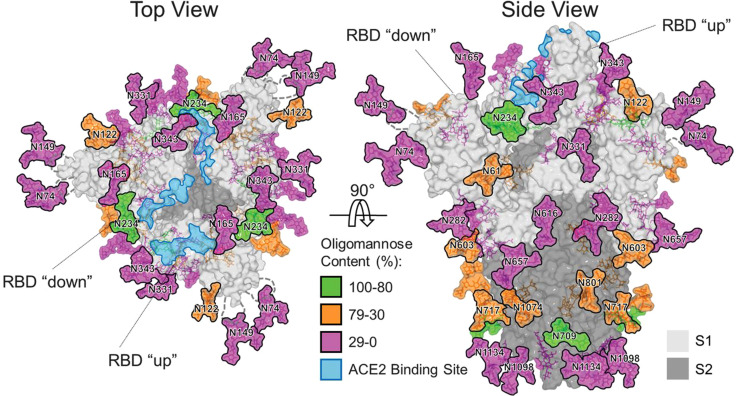
Fig. 22.
The glycan shield of SARS-CoV-2 in top down and side orientations. The glycans are colored according to oligomannose content as defined by the key. ACE-2 receptor binding sites are highlighted in light blue. The S1 and S2 subunits are rendered with translucent surface representation, colored light and dark gray, respectively. The flexible loops on which the N74 and N149 glycan sites reside are represented as gray dashed lines, with glycan sites on the loops mapped at their approximate regions. Reproduced from Ref. [1], under CC BY 4.0.

