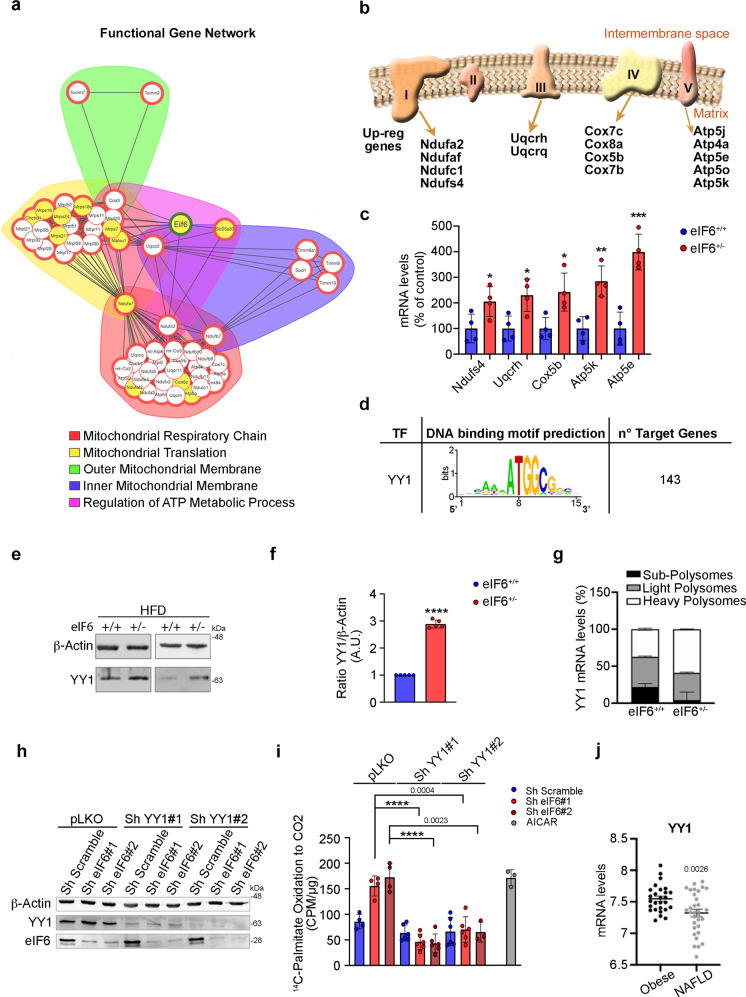
Fig. 7. Mitochondrial target genes regulation is mediated by the spared mTORC1-YY1 axis.
a Functional Gene Network represents the mitochondrial genes correlated to eIF6 expression. b Simplified scheme of upregulated ETC genes identified by RNA-Seq analysis. c Real-time PCR of selected mitochondrial targets (n = 4 for genotype). Two-tailed t test. *p value ≤ 0.05, **p value ≤ 0.01, ***p value ≤ 0.001. d YY1-binding motif predicted in mitochondrial genes associated with eIF6 expression. e Representative western blotting analysis shows that YY1 protein expression level is increased in eIF6+/− livers compared with wt ones. f Densitometric analysis of YY1 expression normalized on β-actin. Data are expressed as an arbitrary unit (n = 5 per genotype). Data are represented as means ± SD. Two-tailed t test. g Real-time PCR of YY1 mRNA on liver polysome fractions reveals that its association with heavy polysomes (white box) is increased in eIF6+/− samples compared with wt (n = 3). Stacked bar charts represent the quantification of selected mRNA levels in heavy, light, and subpolysomes. h, i FAO (fatty-acid oxidation) rates measurement in all indicated conditions. Western blots of analyzed samples (h) and measured counts (i). YY1 depletion reduces 14C-palmitate Oxidation to CO2. Data are indicated as percentage of control (pLKO-ShScramble transduced cells) and represented as means ± SD (n = 4). Two-tailed T test. j NAFLD patients show a reduced expression of YY1 mRNA. Data are presented as mean ± SEM. Two-tailed t test. HFD high-fat diet. Data are provided as a Source Data File.

