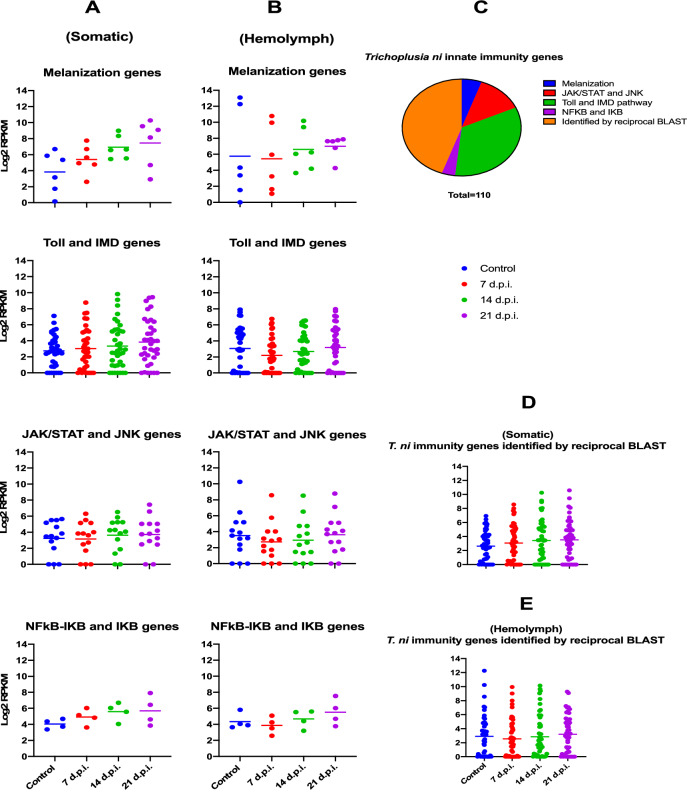
Figure 5.
Dot plots representing the expression level of Trichoplusia ni innate immunity genes post-infection with TnAV. (A) somatic tissues (TnAV initially infects somatic tissues such as fat body, epidermis and tracheal matrix) and subsequently, (B) hemolymph tissue. (C) A pie chart of T. ni innate immunity genes included in this study. Dot plots in (D) and (E) display the expression levels of innate immunity genes identified by reciprocal BLAST in T. ni somatic and hemolymph tissues, respectively. Each dot refers to an innate immunity gene in the specified pathway. Horizontal lines show the mean value .

