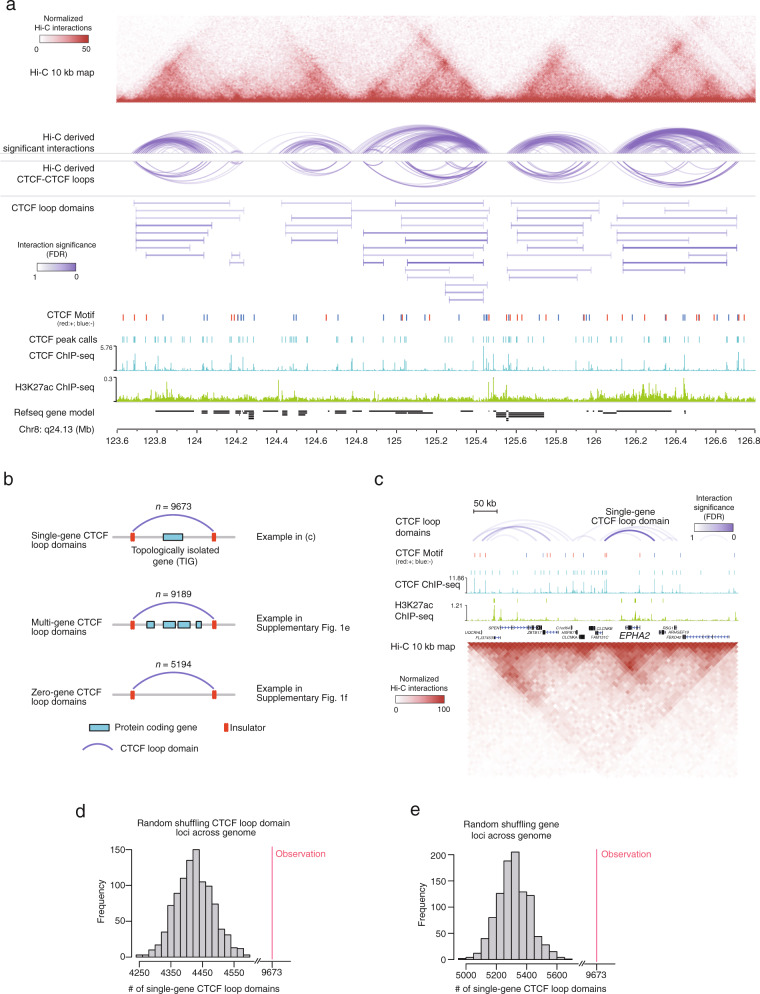
Fig. 1. Topologically insulated regions in HUES64 ES cells.
a Normalized Hi-C interaction map, high-confidence interactions (arc), CTCF-CTCF loops (arc), and CTCF loop domains (line) displayed on top of ChIP-seq profiles of CTCF and H3K27ac at chromosome 8q24.13 region. CTCF peaks are denoted by bars above the ChIP-seq profiles of CTCF. CTCF consensus motifs are denoted by red (forward orientation) and blue (reverse orientation) bars above the CTCF peaks. Normalized Hi-C interactions are shown as a heatmap with each pixel representing a 25 kb genomic region. The interaction significance (FDR) was calculated from Hi-C data. b Illustration of single-gene CTCF loop domains, multi-gene domains, and zero-gene domains. The numbers of domains in each group within HUES64 are displayed on top of each plot. c Display of a single-gene CTCF loop domain and the topologically isolated gene (TIG) at the EPHA2 locus. CTCF consensus motifs, ChIP-seq profiles of CTCF and H3K27ac, and normalized Hi-C interaction maps are displayed. CTCF peaks and enhancers are denoted by bars above the ChIP-seq profiles of CTCF and H3K27ac. CTCF consensus motifs are denoted by red (forward orientation) and blue (reverse orientation) bars above the CTCF peaks. Normalized Hi-C interactions are shown as a heatmap with each pixel representing a 10 kb genomic region. CTCF loop domains are displayed on the top and the interaction significance (FDR) was calculated from Hi-C data. d The distribution of the number of single-gene domains in the human genome by randomly shuffling the domain loci across the genome. The red line indicates the observed number of single-gene domains in the genome. e The distribution of the number of single-gene domains in the human genome by randomly shuffling the gene loci across the genome. The red line indicates the observed number of single-gene domains in the genome.

