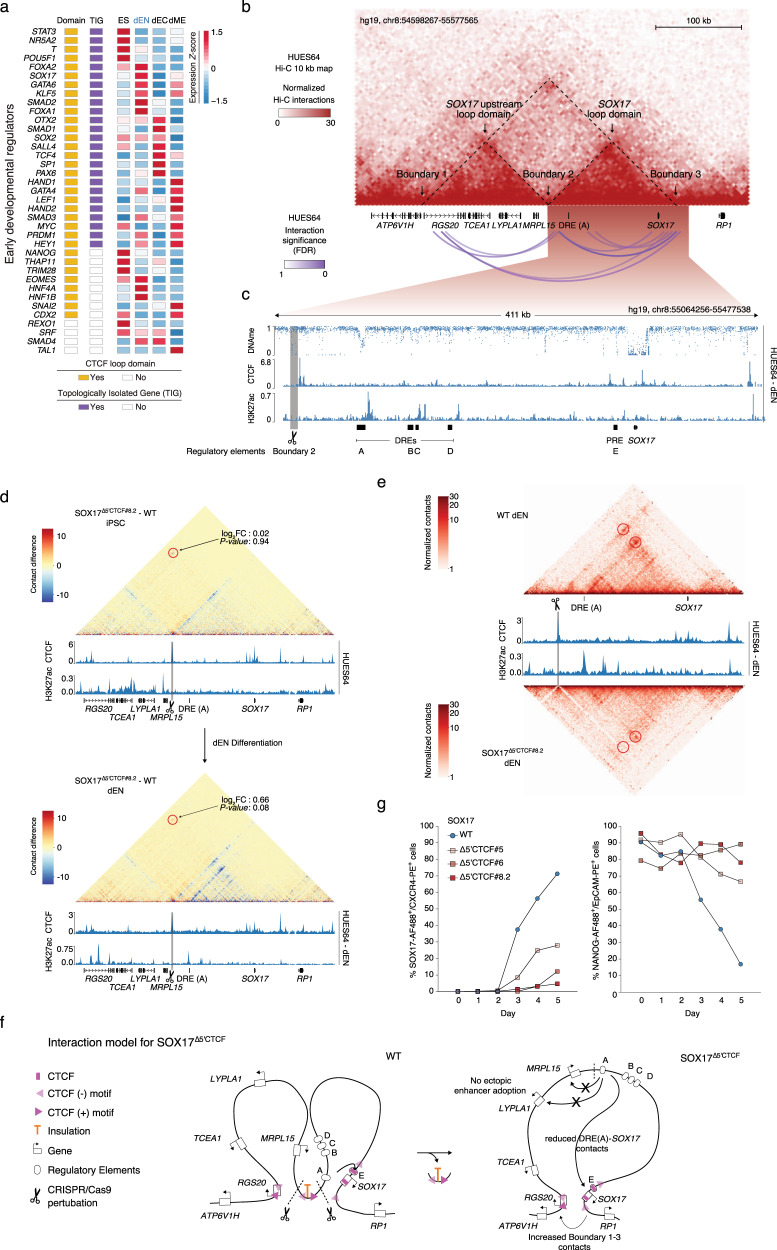
Fig. 4. Single-gene versus multi-gene domain boundary perturbation highlights TIG-dependent gene regulation.
a Heatmap of early developmental regulators displays information on CTCF loop domains, TIGs, and expression in the embryonic stem cell differentiation process. The RPKM (Reads Per Kilobase per Million mapped reads) value of gene expression in embryonic stem (ES) cells, definitive endoderm (dEN), ectoderm (dEC), and mesoderm (dME) were row Z-scored. b Multi-layered display of the SOX17 locus as a representative TIG at chr8:54598267-55577565. HUES64 CTCF loop domains are displayed as arcs below a normalized Hi-C interaction map. c Multi-layered display of HUES64 derived dEN WGBS, CTCF, and H3K27ac ChIP-seq profiles. Putative SOX17 distal regulatory elements (DRE) and proximal regulatory elements (PRE) are highlighted in black bars and given capital letters. The deleted centromeric SOX17 boundary (Boundary 2) is highlighted in grey marked by a scissor. d Capture Hi-C subtraction maps in iPSCs (upper panel) and dEN cells (lower panel) at the SOX17 locus. The relative contact difference between the two samples (SOX17∆5’CTCF#8.2wild-type) in either iPSCs or dEN cells are shown on top of HUES64 or HUES64 derived dEN CTCF and H3K27ac ChIP-seq profiles. Boundary 1 + 3 contact quantifications are highlighted in red circles. The deleted centromeric SOX17 boundary (Boundary 2) is highlighted in grey marked by a scissor. SOX17 DRE (A) and gene bodies are highlighted in black bars. e Capture Hi-C maps in dEN wild-type (upper panel) and SOX17∆5’CTCF#8.2 (lower panel) at the SOX17 loop domain. The normalized capture Hi-C contact maps are overlaid with HUES64 derived dEN CTCF and H3K27ac ChIP-seq profiles. Relative contact differences between Boundary 2+3 or between the SOX17 promoter and DRE (A) are highlighted in red circles. The deleted centromeric SOX17 boundary (Boundary 2) is highlighted in grey and marked by a scissor. Putative SOX17 DRE (A) and SOX17 gene body are shown as black bars. f Simplified 2D-model of the SOX17 boundary 2 perturbation in wild-type or SOX17∆5’CTCF cells. Genes are depicted as white rectangles, regulatory elements as white ellipses. Crucial boundary related CTCF-ChIP-seq peaks are shown in pink; available motif-orientations are highlighted as arrows. Insulation is shown in orange. Dashed lines and scissors indicate the predicted Cas9 cut sites at boundary 2. g Fluorescence activated cell sorting (FACS) time-course data of wild-type and SOX17∆5’CTCF iPSC during directed differentiation towards definitive endoderm. SOX17 and CXCR4 (CD184) are depicted as percentage SOX17+/CXCR4+ in bulk cell populations. Corresponding NANOG and Ep-CAM (CD326) are depicted as percentage NANOG+/Ep-CAM+ in bulk cell populations (n = 2 biologically replicates). Data are presented as mean values.

