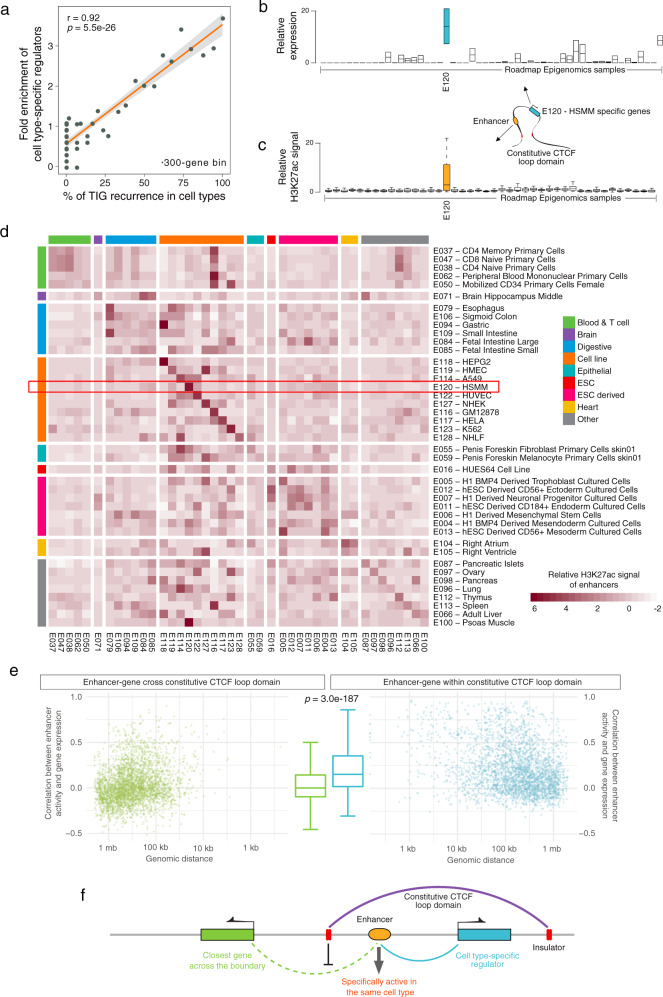
Fig. 7. Co-activation within and insulation across constitutive CTCF loop domains.
a Fold enrichment of cell-type-specific regulators against the recurrence of TIGs in multiple cell types. Each point represents 300 genes. Linear regression line with 95% confidence interval in light gray is shown. P-values calculated by two-sided Pearson correlation test. b Relative expression of cell-type-specific regulators in E120 across all cell types. Relative expression is the expression within a cell type normalized by the mean expression across all cell types. The box indicates the interquartile range (IQR), the line inside the box shows the median, and whiskers show the locations of either 1.5 × IQR above the third quartile or 1.5 × IQR below the first quartile, n = 2 genes. c Relative H3K27ac abundance of enhancers located within the same constitutive domain of the cell-type-specific regulators in E120 across all cell types. Relative H3K27ac abundance is the H3K27ac signal over mean H3K27ac signal across all cell types, which represents enhancer activity. The box indicates the interquartile range (IQR), the line inside the box shows the median, and whiskers show the locations of either 1.5 × IQR above the third quartile or 1.5 × IQR below the first quartile, n = 28 enhancers. d Mean H3K27ac abundance of enhancers located within the same constitutive domain of the cell-type-specific regulators. Each row depicts the mean of the relative H3K27ac abundance of enhancers located within the same constitutive domain of the cell-type-specific regulators in the corresponding cell type across all cell types. The red box indicates the mean value of the boxplot in c. Note that some tissues and cell lines are functionally related, which may drive the enrichment off the diagonal, such as hematopoietic cell-type-specific enhancers being also enriched in GM12878 and thymus. Enhancers specific to cell lines are stronger and uniquely enriched in a specific cell type, such as HEPG2 enhancers. Some enhancers show tissue-type-specific properties instead of cell type specificity, such as enhancers of ESCs and derivatives, hematopoietic cells, and heart cells. e Correlation between enhancer activity and within-constitutive domain-neighbor gene expression (left plot in green) and correlation between enhancer activity and cross-constitutive domain-neighbor gene expression (right plot in blue). The boxplot shows the whole distributions of the data shown on the left and right. The box indicates the IQR, the line inside the box shows the median and whiskers show the locations of 1.5 × IQR above the third quartile and 1.5 × IQR below the first quartile, n = 3,611 enhancers. Note that only cell-type-specific regulators (TIGs) and their constitutive domains are included in this analysis. f Model of co-activation of enhancer and cell-type-specific regulators within the same single-gene constitutive domain. The schematic also depicts the insulation function of constitutive domain boundaries.

