Figure 6.
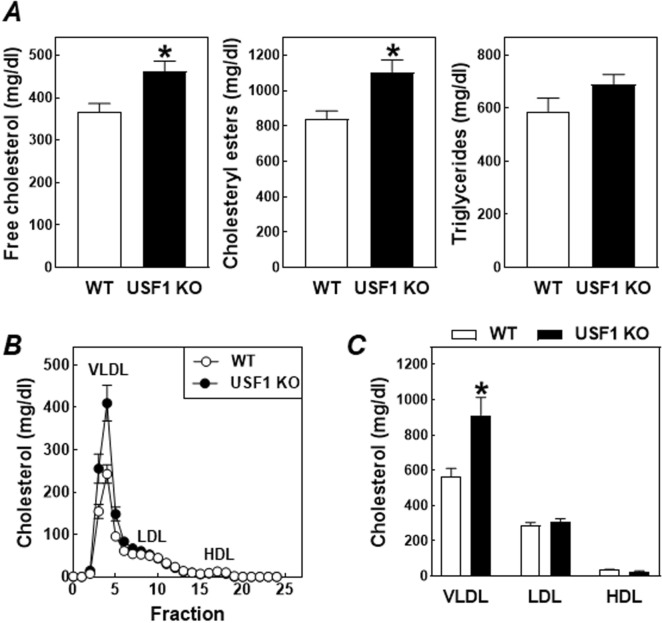
Plasma levels of free cholesterol, cholesteryl esters and triglycerides (A) and the distribution of total cholesterol over the different lipoproteins (B,C) in LDL receptor knockout mice transplanted with bone marrow from USF1 knockout (USF1 KO) mice or their wild-type (WT) littermate controls. Fractions 1–6 represent VLDL, fractions 7–13 LDL, and fractions 14–22 HDL. Data represent the means ± SEM of respectively 11 WT and 16 USF1 KO bone marrow recipients. *P < 0.05 versus WT.

