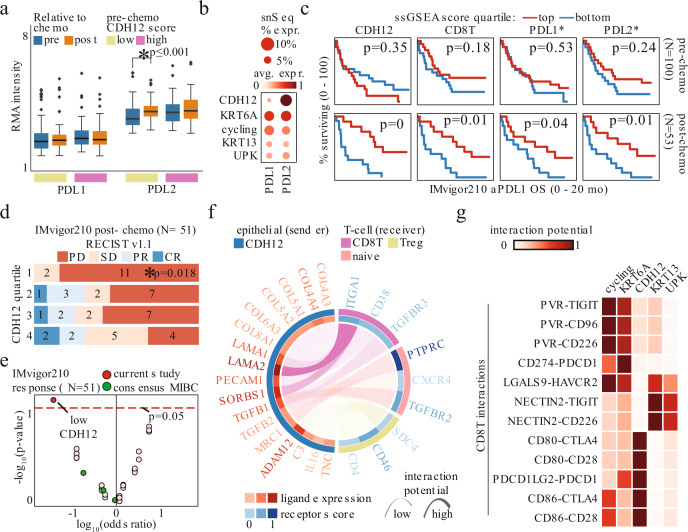
Fig. 4. Post-chemo CDH12 score predicts favorable response to immune checkpoint therapy.
a PDL1 and PDL2 in matched pre-chemo and post-chemo samples (* - Wilcoxon paired two-sided rank-sum test p < 0.05; n = 65 for low CDH12, n = 49 for high CDH12). Boxplots are drawn as the inter-quartile range (IQR) with a line indicating the median, and outliers defined as points that fall outside of the range demarcated by 1.5*IQR. Source data are available as a Source data file. b PDL1 and PDL2 expression in snSeq tumor epithelial cells. c Overall survival in IMvigor 210 Cohort 2 bladder tumors sequenced pre-chemo (top, N = 100) or post-chemo (bottom, N = 53) stratified by snSeq-derived population signature scores, or gene expression value (log-rank test, p = 0 indicates p < 0.001; * indicates gene expression). d RECIST v1.1 response in bladder tumors profiled post-chemo stratified by CDH12 score quartile; progressive disease (PD), stable disease (SD), partial response (PR), complete response (CR) (* - Fisher exact test for PD vs PR/CR in quartile 1 vs quartile 4, N = 51). e Association of snSeq-derived signature scores, or consensus MIBC subtypes, with RECIST v1.1 response in the IMvigor 210 Cohort 2 cases shown in d (Fisher exact test, N = 51). f snSeq-derived receptor-ligand interactions significantly enriched between CDH12 population and each T-cell population. g snSeq-derived receptor-ligand interaction potential of co-inhibitory signaling from epithelial populations to the CD8T population.

